
 Oslo Børs
 Stockholmsbörsen
 Københavns Fondsbørs
Investeringsforeninger
Københavns Fondsbørs
Investeringsforeninger
 Helsingin pörssi
 World Indices
 US Stocks
US 30
Nasdaq 100
US 500
US Stocks
US 30
Nasdaq 100
US 500
 Toronto Stock Exchange
 London Stock Exchange
 Euronext Amsterdam
 Euronext Brussel
 DAX
SDAX
TECDAX
Frankfurt
CDAX
MDAX
Prime Standard
DAX
SDAX
TECDAX
Frankfurt
CDAX
MDAX
Prime Standard
 CAC 40
 Mumbai S.E.
National S.E.
Mumbai S.E.
National S.E.
 Commodities
 Currency
 Cryptocurrency
 Exchange Traded Funds
 Investtech Indices
The Trend Bible
 Tel: +47 21 555 888
 E-mail us
 Request a call
 Visit us
Buy and hold stocks in rising trends. Sell and stay away from stocks in falling trends.
Technical Analysis Theory on Trends

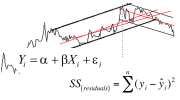
Rising trend where a stock with positive fundamental development over time ranges from price P/E=12, which many investors think is cheap, to P/E=15, which many investors think is expensive.
Investtech's help pages about trends and other technical indicators is located under the Insight & Skills tab and also show which of the bigger companies are in rising trends right now.
The following is taken from Investtechs help pages on trends.
The trend is one of the most important indicators of technical analysis. According to technical analysis theory, stocks that are in rising trends will continue to rise, and stocks in falling trends will continue to fall. Investtechs research shows that this theory is correct; please find the research reports under the Research tab on top of the page.
This makes it very important to identify whether a stock is in a rising or falling trend. It is also important to recognise when trends change, in order to get out early in the case of a falling trend and get in early in the case of a rising one.
The trend is a simple indicator to follow. Every day Investtechs systems identify the qualitatively best trend for each stock. Stocks in rising trends should be bought and stocks in falling trends should be sold.

Buy and hold stocks in rising trends

Sell and stay away from stocks in falling trends

Stocks in sideways trends can be bought near the trend floor and sold near the trend ceiling
Main principles
The bottom line of trend analysis is simple: The trend is your friend.
- Buy and hold stocks in rising trends.
- Sell and stay away from stocks in falling trends.
- Stocks in sideways trends can be bought near the trend floor and sold near the trend ceiling.
Warning signals
- Price near trend floor indicates greater upside, but also greater risk of a break downward.
- Price near trend ceiling indicates a smaller upside, but also a greater chance of a break upward.
Trend breaks
It may appear that a stock should be sold when it breaks downwards from a rising trend. However, this often simply signals that the stock is taking a small break and will continue upwards soon. The following applies when assessing trend breaks:
- High volume strengthens a break and signals a possible trend reversal.
- Low volume indicates that the stock will soon continue in the same trend direction.
- For rising trends: break below previous bottom signals a reversal downward.
- For falling trends: break above the previous top signals a reversal upward.
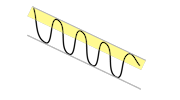
The key principle of trend analysis is simple: the stock will continue in the direction of the trend.
Depending on where the price is in relation to the trend channel, strong or weak development is indicated.
- Stocks with rising trends will continue upwards, and stocks with falling trends will continue to fall.
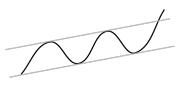
- Break upwards through the ceiling of a rising trend indicates further rise at a stronger rate of increase that previously.
- Break downwards through the floor of a rising trend indicates further rise or more horizontal development, with a weaker rate of increase than previously.
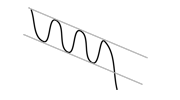
- Break downwards though the floor of a falling trend indicates further fall with a stronger rate of decrease than previously.
- Break upwards through the ceiling of a falling trend indicates further fall or a more horizontal development, with a weaker rate of decrease than previously.
- Stocks with break upwards from horizontal trend will continue upwards, and stocks with break downwards from horizontal trend will continue downwards.
The conditions above are theoretically valid for all time perspectives, both in the short term of even a few days or weeks, up to the long term with trends that encompass several years.
The Trend Bible shows how correct this theory proved to be in practice on the Nordic stock exchanges in the period 1996 to 2015, and describes how such research can be carried out objectively.
Read more and see examples from todays market on Investtechs help pages for technical analysis.
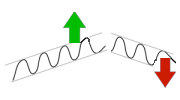
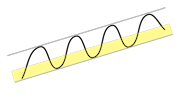
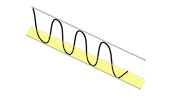
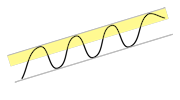
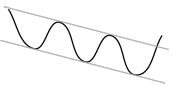
Stocks within a trend:
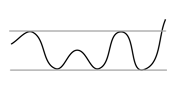
Stocks breaking out of a trend:
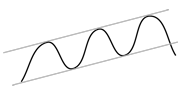
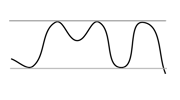
Sideways trend:
Investtech's reference work based on studies of more than 350,000 signals from trends in stocks listed on
the Nordic stock exchanges from 1996 to 2015.
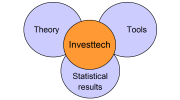
Practical use - Tools - Statistics - Algorithms - Theory.
The Trend Bible - Start Page More on Investtech's research

The Trend Bible was written in 2016 by Investtechs Head of Research Mr. Geir Linløkken. The research team behind the Trend Bible also consists of Senior Researchers Asbjørn Taugbøl and Fredrik Tyvand.
Investtech has worked on research into behavioural finance and technical and quantitative stock analysis since 1997. The company has developed an analysis system that identifies trends, support and resistance, formations and volume patterns in stock prices, and uses these to generate buy and sell signals. Investtech uses advanced mathematical algorithms and statistical methods in computer programmes and online subscription services.
Investtech guarantees neither the entirety nor accuracy of the analyses. Any consequent exposure related to the advice / signals which emerge in the analyses is completely and entirely at the investors own expense and risk. Investtech is not responsible for any loss, either directly or indirectly, which arises as a result of the use of Investtechs analyses. Details of any arising conflicts of interest will always appear in the investment recommendations. Further information about Investtechs analyses can be found here disclaimer.
The content provided by Investtech.com is NOT SEC or FSA regulated and is therefore not intended for US or UK consumers.
Head office
Strandveien 171366 Lysaker, Norway
Research department
Instituttveien 102007 Kjeller, Norway