
 Oslo Børs
 Stockholmsbörsen
 Københavns Fondsbørs
Investeringsforeninger
Københavns Fondsbørs
Investeringsforeninger
 Helsingin pörssi
 World Indices
 US Stocks
US 30
Nasdaq 100
US 500
US Stocks
US 30
Nasdaq 100
US 500
 Toronto Stock Exchange
 London Stock Exchange
 Euronext Amsterdam
 Euronext Brussel
 DAX
SDAX
TECDAX
Frankfurt
CDAX
MDAX
Prime Standard
DAX
SDAX
TECDAX
Frankfurt
CDAX
MDAX
Prime Standard
 CAC 40
 Mumbai S.E.
National S.E.
Mumbai S.E.
National S.E.
 Commodities
 Currency
 Cryptocurrency
 Exchange Traded Funds
 Investtech Indices
Investtech Research: Golden Cross and Death Cross, moving average signal statistics
Published 2 November 2022
Written by senior researcher Asbjørn Taugbøl, head of R&D Geir Linløkken and senior researcher Fredrik Tyand.
Abstract:
Moving average is one of the oldest and most used indicators in technical analysis. And yet there is little published research that looks at how well these signals work. A common strategy is buying when the 50-day moving average crosses above the 200-day moving average, and selling when it crosses below. Another strategy is comparing stock price to the 200-day moving average and selling when the price crosses below the 200-day average. We have studied how well this strategy has worked in the Nordic markets in the period 2008 2020. This work was supported by the Norwegian Research Council.
Buy and sell signals from moving average
With support from the Norwegian Research Council, we have conducted a study into price development following buy and sell signals from the moving average indicator. The data are every listed stock in the Nordic countries in the period 1 January 2008 to 31 December 2020. This is a period of 13 years with both long uptrends, downtrends and sideways movements. In the statistical results, we have studied price development in the 3 months (66 days) following the signals. The results were compared to market development in the same period after the signals in order to calculate excess return.
We have not found relevant studies using scientific methods that recommend using moving average in a trading strategy in order to achieve excess return. See Glendrange, James, Satav and Praekhaow in the literature list at the end of this article.
About the analyses
We used the 50-day moving average as short term indicator and the 200-day moving average as long term indicator. A buy signal was triggered when the short term average crossed above the long term average, and a sell signal when the short term average crossed below the long term average.
 Golden Cross: Short term average crosses above long term average, which shows that during a certain shorter time period the price has risen more than it has during a certain longer period. This indicates that optimism is on the rise and the theory says the stock price will continue upwards.
Results for 50 days crossing 200 days
Analyses were conducted to identify signals and calculate absolute and relative return from these signals. 5235 buy signals and 4451 sell signals were identified. This is a strong foundation for statistical analyses.
Golden Cross buy signals
Average return for buy signals is shown in the chart below.
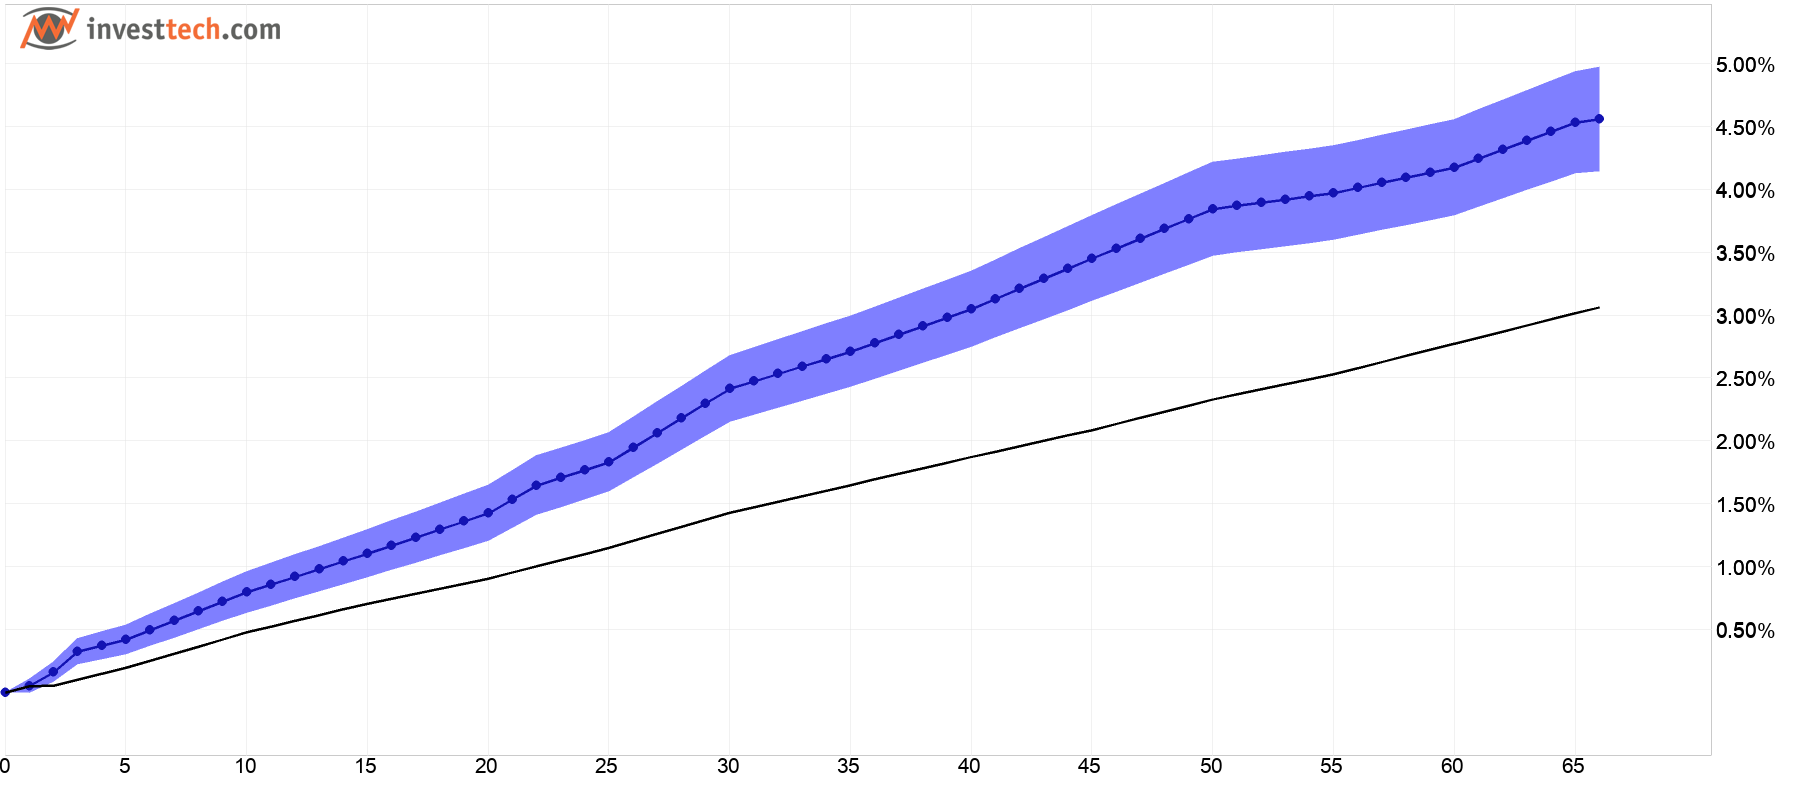
Figure 1: Return following buy signal from 50-day short term moving average crossing above 200-day long term moving average. Blue line is signal stocks, black is benchmark. Shaded blue area shows standard deviation of the signal stocks. The Nordic markets 2008-2020.
| Return and relative return after 66 days | |
| Buy signal | 4.56 % |
| Benchmark in same period | 3.06 % |
| Excess return buy signal | 1.50 %p |
| Annualised return (based on 66-day figures) | |
| Buy signal | 18.6 % |
| Benchmark in same period | 12.7 % |
| Excess return buy signal | 5.8 %p |
pp = percentage point, i.e. the arithmetic difference of the percentage returns. Annualised figures are calculated by repeating the 66-day figures for one year, assuming an average year has 252 stock exchange days.
Nordic stocks with buy signals from moving average have shown a good and fairly even rise throughout the whole 66-day period. On average the stocks had good excess return vs benchmark. The rise was strongest the first 30 days following the signal.
After three months, the stocks with buy signal had on average risen 4.6 per cent, which equals an excess return of 1.5 percentage points vs benchmark. Annualised excess return was 5.8 percentage points. A T-value of 3.6, but with quite strongly correlated data, suggests moderate statistical significance.
There were large variations between the Nordic countries, but all had positive return and positive excess return, and the combined results are considered consistent.
The results for these buy signals are in line with technical analysis theory.
Death Cross sell signals
Analyses of the same type of sell signal showed that the stocks on average developed the same as benchmark, i.e. the sell signals had no predictive power.
Read more about the results for Death Cross signals here.
Signal varieties
We also wanted to see whether the averages direction influenced results and defined three kinds of signals:
- Normal kind: Falling long term average, rising short term average.
- Strong kind: Both averages are rising.
- Weak kind: Both averages are falling.
 Buy signal, normal kind. |
 Strong kind. |
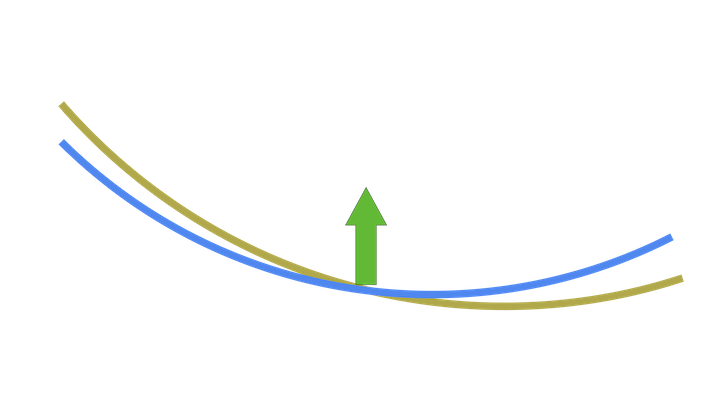 Weak kind. |
Results normal kind
This kind of signal had low predictive power.
Results strong kind
The chart below shows average return for buy signals where both short and long term moving averages were rising, i.e. the strong kind of signal. The strong kind results were better than the general results above.
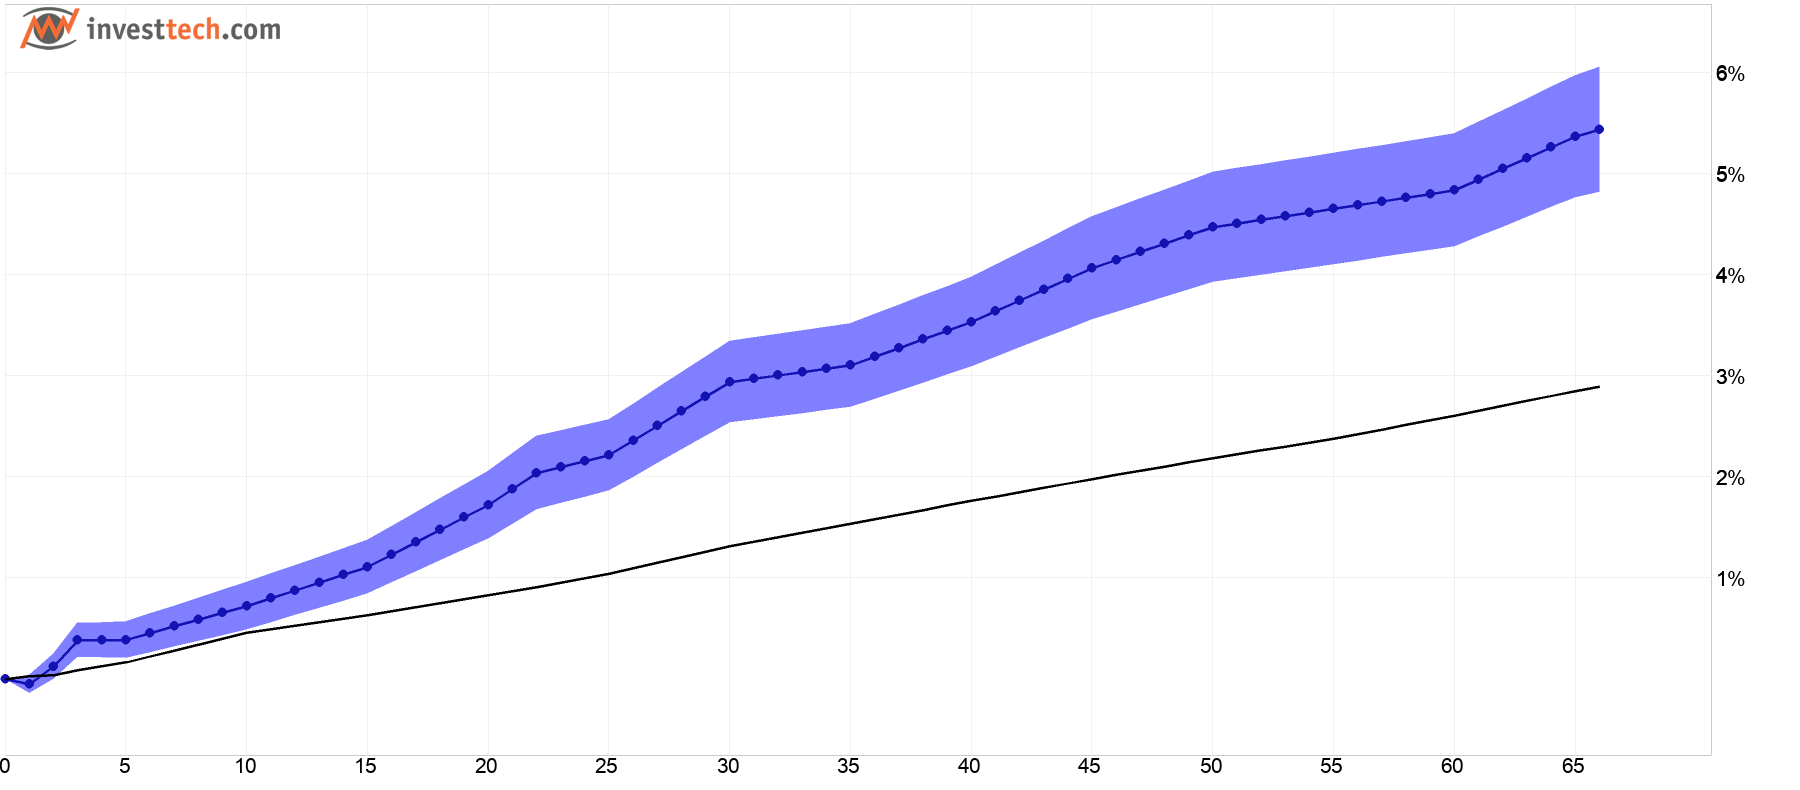
Figure 2: Return following buy signal from short term moving average crossing above long term moving average, strong kind. Blue line is signal stocks, black line is benchmark. Shaded blue area is standard deviation of signal stocks. The Nordic markets 2008-2020.
| Return and relative return after 66 days | |
| Buy signal | 5.44 % |
| Benchmark in same period | 2.89 % |
| Excess return buy signal | 2.54 %p |
| Annualised return (based on 66-day figures) | |
| Buy signal | 22.4 % |
| Benchmark in same period | 12.3 % |
| Excess return buy signal | 10.1 %p |
Stocks with buy signals from 50-day moving average crossing above 200-day moving average, and where both short and long term averages are rising, on average had a rise of 5.44 per cent after 66 days. This equals an excess return of 2.54 percentage points vs benchmark and an annualised excess return of 10.1 percentage points. Signal stocks show a small decline the first day after signal was triggered and then rise for the rest of the 66-day period. A T-value of 4.1 indicates good statistical significance.
If a moving average is rising, its fair to say the market is in an uptrend, and similarly a falling moving average indicates a downtrend in the market. The signals may be stronger if both averages are rising, explained by both short and long term investors becoming more optimistic.
The number of signals was relatively low. There were only 567 signals from Norwegian stocks during a period of 13 years. This is less than 1/10th of the number of trend signals in the same period.
Stocks in rising trends in the same period gave an annualised excess return of 6.5 percentage points and a T-value as high as 13.6.
Results weak kind
This kind of signal had low predictive power.
Results for signals where stock price crosses 200 days
In addition to 50-day short term average and 200-day long term average, the stock price is often used as a short term indicator and a signal triggered when the stock price crosses the 200-day moving average. We also studied return following this kind of signal in the same data set as above.
Stocks with buy signal and sell signal from stock price crossing above and below the 200-day moving average have developed in line with benchmark. T-values are also low. Combined this indicates low predictive power.
Summary and conclusions
- Golden Cross (50-day moving average crossing above 200-day moving average):
- Good signal value when long term average was also rising, annualised excess return of a full 10.1 percentage points.
- No signal value when long term average was falling.
- Death Cross (50-day moving average crossing below 200-day moving average) had low signal value.
- Stock price crossing above or below the 200-day moving average had no signal value.
- Geir Linløkken. Investtech Research: Return following signals from price formations in stock prices, Nordic markets 1996-2018, Investtech 2020.
- Geir Linløkken, Asbjørn Taugbøl, Fredrik Tyvand. Investtech-forskning: Støtte og motstand - signalstatistikk Norden 2019 og 2020, Investtech 2021. In Norwegian only.
- Geir Linløkken, Asbjørn Taugbøl, Fredrik Tyvand. Investtech-forskning: Innsidehandler - signalstatistikk Norge, Sverige og Danmark 2019 og 2020, Investtech 2021. In Norwegian only.
- Geir Linløkken. Volumbalanse - signalstatistikk nordiske markeder 1996 til 2018, Investtech 2020. In Norwegian only.
- Geir Linløkken, Asbjørn Taugbøl, Fredrik Tyvand. Investtech Research: Return following testing of and breaks through support and resistance in stock prices, the Nordic markets, 1996-2018, Investtech 2019.
- Asbjørn Taugbøl. Stocks in rising trends have given excess return in the Nordic markets, Investtech 2019.
- Asbjørn Taugbøl. Trend signals better than theory suggests, Investtech 2019.
- Geir Linløkken. Innsidekjøp som indikator for videre kursutvikling i aksjen, Investtech 2019. In Norwegian only.
- Geir Linløkken. RSI is a good momentum indicator, Investtech 2019.
- Geir Linløkken. Investtech Research: Return following signals from rectangle formations in stock prices - medium term, Nordic markets, 1996-2018, Investtech 2019.
- Geir Linløkken and Steffen Frölich. Technical Stock Analysis - for lower risk and increased return. Investtech.com, 2001.
- John J. Murphy. Technical Analysis of the Financial Markets. New York Institute of Finance, 1999.
- Glendrange, G., & Tveiten, S. (2016). Testing the Performance of Simple Moving Average With the Extension of Short Selling. University of Agder, 2016 School of Business and Law Department of Economics and Finance, 1-63.
- James, Jr, F. E. (1968, September). Monthly Moving Averages--An Effective Investment Tool? Cambridge University Press, 3(3), 315-326.
- Ms. Satav, S., & Dr. Apte, N. (2020, July). THE MOVING AVERAGE CROSSOVER STRATEGY: A STUDY. Inspira- Journal of Modern Management & Entrepreneurship (JMME), 10(3), 141-146.
- Praekhaow, P. (2010, June). Determination of Trading Points using the Moving Average Methods. Department of Mathematics, Faculty of Science, King Mongkuts University of Technology Thonburi, Bangkok 10140, Thailand, 1-5.
Literatur
Keywords: Forskningsresultater,Glidende snitt,Kjøpssignal,Salgssignal.
Written by

Analyst
at Investtech
"Investtech analyses the psychology of the market and gives concrete trading suggestions every day."

Partner & Senior Advisor - Investtech


Investtech guarantees neither the entirety nor accuracy of the analyses. Any consequent exposure related to the advice / signals which emerge in the analyses is completely and entirely at the investors own expense and risk. Investtech is not responsible for any loss, either directly or indirectly, which arises as a result of the use of Investtechs analyses. Details of any arising conflicts of interest will always appear in the investment recommendations. Further information about Investtechs analyses can be found here disclaimer.
The content provided by Investtech.com is NOT SEC or FSA regulated and is therefore not intended for US or UK consumers.
Head office
Strandveien 171366 Lysaker, Norway
Research department
Instituttveien 102007 Kjeller, Norway