
 Oslo Børs
 Stockholmsbörsen
 Københavns Fondsbørs
Investeringsforeninger
Københavns Fondsbørs
Investeringsforeninger
 Helsingin pörssi
 World Indices
 US Stocks
US 30
Nasdaq 100
US 500
US Stocks
US 30
Nasdaq 100
US 500
 Toronto Stock Exchange
 London Stock Exchange
 Euronext Amsterdam
 Euronext Brussel
 DAX
SDAX
TECDAX
Frankfurt
CDAX
MDAX
Prime Standard
DAX
SDAX
TECDAX
Frankfurt
CDAX
MDAX
Prime Standard
 CAC 40
 Mumbai S.E.
National S.E.
Mumbai S.E.
National S.E.
 Commodities
 Currency
 Cryptocurrency
 Exchange Traded Funds
 Investtech Indices
Investtech Research: Price shocks in Nordic stocks can be used as buy and sell signals
By Head of R&D Mr. Geir Linløkken and research assistant Mr. Fredrik Dahl Bråten, Investtech, published October 6th, 2022.
Abstract: A price shock is when a stock price rises or falls unusually hard. International research into price shocks suggests that such stocks are usually followed by negative return, regardless of the price shocks direction. We have studied this effect in the Nordic markets. Based on previous Investtech research, we figured that the negative return could not exclusively be explained by price shocks, but rather by the stocks high volatility. By excluding the most volatile stocks from the data set, we found that stocks with positive price shocks continued rising and stocks with negative price shocks continued falling. In other words, for normal volatile stocks with positive price shocks, the results are the opposite of that indicated by international research.
Absolute price shocks
International research has largely studied absolute price shocks, i.e. percentage change in closing price from one day to the next. Negative return of 6 and 13 percentage points following large positive and negative price shocks respectively were found in the month following the price shocks.
Our data from the Nordic stock markets in the period 2008 to 2020 showed that both positive and negative absolute price shocks statistically were followed by assumed statistically significant negative excess return vs benchmark. The strongest effects were seen for the largest price shocks, with a price rise of at least 27 per cent or a fall of at least 19 per cent from one day to the next. Shocks this big were identified approximately once every second or third year per stock. Negative excess returns the following month were 6.3 and 1.8 percentage points for positive and negative price shocks respectively.
The largest absolute price shocks tend to come from stocks with high volatility. Thus, such stocks represent a disproportionately large percentage of the buy and sell signals from absolute price shocks. Based on our previous research into excess return from buy and sell signals from highly volatile stocks, it made sense to study whether negative excess return after positive price shocks ties in with higher volatility in the stock, rather than being an effect of the price shock itself.
Volatility-normalized price shocks
Certain high-risk stocks can fluctuate 5-10 per cent on an average day, while low-risk stocks barely fluctuate 1 per cent. Consequently, we think that percentage change alone is not sufficient an identifier of a price shock. We calculated volatility-normalized price shocks as closing price change in per cent, adjusted for the stocks volatility in the last 22 days. The measurement variable is thus price change divided by volatility. The 1.5 per cent biggest price shocks are considered buy and sell signals. This equals a price change of approximately five volatility-normalized price changes standard deviations, so that the signal was triggered when the stock in one day changed more than five times the daily standard deviation.
We chose to remove high volatility stocks from the data set, in order to exclude the negative excess return effect from high volatility stocks as much as possible. This means that stocks with an average monthly volatility of 30 per cent or more are excluded from the data set.
Results for buy signals from volatility-normalized price shocks
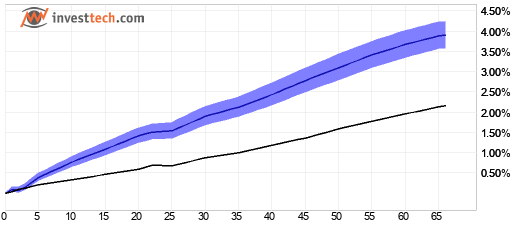
Figure 1: Nordic markets combined. Return following buy signals from volatility-normalized price shocks. Thick blue line is signal stocks, thin black line is benchmark. Nordic markets 2008-2020.
| Annualised return (based on 66-day figures) | Norway | Sweden | Denmark | Finland | Weighted average |
| Buy signal | 13,8 % | 17,7 % | 14,8 % | 12,8 % | 15,8 % |
| Benchmark in the same period | 5,8 % | 9,9 % | 11,4 % | 7,9 % | 9,0 % |
| Excess return, buy signal | 8,0 pp | 7,8 pp | 3,4 pp | 4,9 pp | 6,8 pp |
pp = percentage point, i.e. the arithmetic difference of the percentage returns. Annualised figures are calculated by repeating the 66-day figures for one year, assuming an average year has 252 stock exchange days.
On average, stocks with positive volatility-normalized price shocks continued rising. After three months, stocks with buy signals had on average risen 3.9 per cent, an excess return of 1.7 percentage points vs benchmark. Statistical measurement values indicate high statistical significance.
All four Nordic markets showed good price increase and excess return for signal stocks. The combined results are considered consistent even though the specific return figures vary. Buy signals from volatility-normalized price shocks are statistically considered to give good signals that can be a basis for making investment decisions in individual stocks.
Results for sell signals from volatility-normalized price shocks
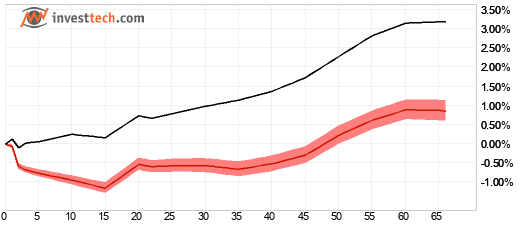
Figure 2: Nordic markets combined. Return following sell signals from volatility-normalized price shocks. Thick red line is signal stocks, thin black is benchmark. Nordic markets 2008-2020.
| Annualised return (based on 66-day figures) | Norway | Sweden | Denmark | Finland | Weighted average |
| Sell signal | -8,8 % | 8,9 % | -1,0 % | 4,7 % | 3,3 % |
| Benchmark in same period | 5,8 % | 16,1 % | 9,3 % | 9,3 % | 12,0 % |
| Excess return, sell signal | -14,6 pp | -7,3 pp | -10,3 pp | -4,6 pp | -8,6 pp |
On average, stocks with sell signals have risen following the signals for the Nordic markets combined. However, the rise has been a lot lower than benchmark in the same period, and negative excess return has increased over the following three-month period.
After three months, stocks with sell signals had on average risen 0.9 per cent, a negative excess return of 2.3 percentage points vs benchmark. Annualised negative excess return was 8.6 percentage points. Statistical measurement values indicate high statistical significance.
Sell signals from negative volatility-normalized price shocks are considered to be good input into a technical stock trading strategy for identification of stocks to sell and stay away from.
Summary and conclusion
Stocks where the price on a single day changes to an unusual degree are said to trigger price shocks. Following absolute price shocks, we found that stocks with positive and negative price shocks both underperformed compared to benchmark, in line with previous research.
When we normalized the price shocks for the stocks volatility, and also excluded the most volatile stocks, we found that stocks with positive price shocks were followed by excess return of assumed statistical significance. Stocks with negative price shocks were followed by assumed statistically significant negative excess return.
The results indicate that stocks with volatility-normalized price shocks, larger than five times normal daily fluctuations, statistically will give excess return in the same direction as the price shock.
Robustness measures indicate that it will be statistically beneficial to sell stocks with negative price shocks, and at the same time beneficial to buy stocks with positive price shocks, in addition to always staying away from the most volatile stocks.
Further details and discussion of results can be found in Norwegian in this research report (Professional subscription required).
References
- Fredrik Dahl Bråten, Geir Linløkken. 2022. Investtech-forskning: Prissjokk - signalstatistikk nordiske markeder 2008-2020. Investtech. Norwegian only.
- Lalwani, Vaibhav, Udayan Sharma, and Madhumita Chakraborty. 2019. Investor reaction to extreme price shocks in stock markets: A cross country examination. IIMB Management Review 31 (3): 258-267.
- Lu, Hai, Kevin Q. Wang, and Xiaolu Wang. Price Shocks, News Disclosures, and Asymmetric Drifts. The Accounting Review 89, no. 5 (2014): 180534.
- Linløkken, Geir. 2021. Investtech-forskning: Sterkest signaler i lavlikvide aksjer. Investtech. Norwegian only.
Written by

Fredrik Dahl Bråten
Analyst
Investtech
"Investtech analyses the psychology of the market and gives concrete trading suggestions every day."

Partner & Senior Advisor - Investtech


Investtech guarantees neither the entirety nor accuracy of the analyses. Any consequent exposure related to the advice / signals which emerge in the analyses is completely and entirely at the investors own expense and risk. Investtech is not responsible for any loss, either directly or indirectly, which arises as a result of the use of Investtechs analyses. Details of any arising conflicts of interest will always appear in the investment recommendations. Further information about Investtechs analyses can be found here disclaimer.
The content provided by Investtech.com is NOT SEC or FSA regulated and is therefore not intended for US or UK consumers.
Head office
Strandveien 171366 Lysaker, Norway
Research department
Instituttveien 102007 Kjeller, Norway