
 Oslo Børs
 Stockholmsbörsen
 Københavns Fondsbørs
Investeringsforeninger
Københavns Fondsbørs
Investeringsforeninger
 Helsingin pörssi
 World Indices
 US Stocks
US 30
Nasdaq 100
US 500
US Stocks
US 30
Nasdaq 100
US 500
 Toronto Stock Exchange
 London Stock Exchange
 Euronext Amsterdam
 Euronext Brussel
 DAX
SDAX
TECDAX
Frankfurt
CDAX
MDAX
Prime Standard
DAX
SDAX
TECDAX
Frankfurt
CDAX
MDAX
Prime Standard
 CAC 40
 Mumbai S.E.
National S.E.
Mumbai S.E.
National S.E.
 Commodities
 Currency
 Cryptocurrency
 Exchange Traded Funds
 Investtech Indices
TECHM, NIFTY50 and Hausse Index
Published Noember 01, 2018
Tech Mahindra Limited (TECHM.NS) Close: 743.90
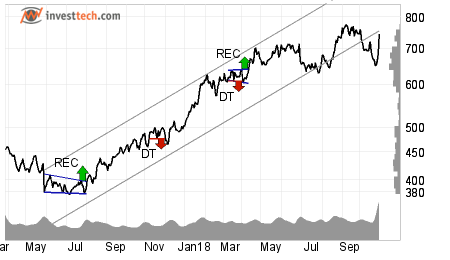
Tech Mahindra Limited has broken through the floor of a rising trend channel in the medium long term. This indicates a slower rising rate at first, or the start of a more horizontal development. The stock has broken a resistance level in the short term and given a positive signal for the short term trading range. The stock is between support at rupee 716 and resistance at rupee 774. A definitive break through of one of these levels predicts the new direction. Positive volume balance shows that volume is higher on days with rising prices than days with falling prices. This indicates increasing optimism among investors. The stock is overall assessed as technically positive for the medium long term.
Investtech's outlook (one to six months): Positive
Nifty 50 index developed positively on Wednesday, and gained 1.85 per cent to a close of 10387 points. For October as a whole, the index showed a loss of 5.0 %.
996 shares were up and 493 were down, while 62 remained unchanged, and there was no trading in 252 shares yesterday.
The total value of the trading volume for shares and primary capital certificates Wednesday was approximately 401.7 billion.
Top 3 among the most traded stocks on Tuesday, were Reliance Industries Limited (+0.11 %), Housing Development Finance Corporation Limited (+5.70 %) and HDFC Bank (-0.35 %).
Nifty is still holding our 10000 mark and trying to catch a breath before further moves are decided by the market players.
Our overall outlook on Nifty 50 index is Watch for the medium term until it breaks on either side of 10000 and 10600 points.
Out of Nifty 50 stocks, 36 advanced while 14 declined making the advance decline ratio greater than one at 2.57 and in favour of bulls. We will look at something similar in our report today, the Bigger Picture of the Sentiment or the Hausse Index.
Hausse index:
The Hausse Index is an indicator for market optimism, or more generally a sentiment indicator. It shows the ratio of investors who are positive in the market. Analysis of the hausse index can be an important part of an overall market analysis. Hausse analysis can show the level of optimism among short term and long term investors, and whether the optimism is rising or falling. In special situations, following long rises or falls, hausse analysis can identify the turning points in the market.
The Hausse index shows the ratio between number of companies that have triggered buy signals and total number of companies. The index has a value between 0 and 100, where 0 means that every companys last signal was a sell signal, and 100 means that every companys last signal was a buy signal. Values above 50 indicate that a majority of investors are positive.
Investtechs short term hausse index (hausse1) measures optimism among short term investors. The index is a good gauge for the level of activity in the market among investors who tend to keep a stock for one to six weeks.
Investtechs long term hausse index (hausse2) measures optimism among long term investors. It shows mood swings in the market among long term investors who tend to keep the same stock for several months or years.
For the Indian stock market, the value of Hausse1 for NSE or short term hausse is at 30. It suggests that pessimism is persisting among short term investors, while optimism is taking a rest. However, the value increased by 14 points in course of one week, which is a significant gain. This may provide some relief to the short term investors.
For the longer term, Hausse 2 is currently at 18, unchanged since last week but less than the short term value. This overall indicates that the bigger picture is looking dimmer for the Indian stock market in comparison to the short term hausse index.
The take away from this is that one should be cautious in the current market scenario where uncertainty is prevalent. Keep a hawk's eye on any market opportunity you get, but use your wise judgement. After all, it's your hard earned money.
The analyses are based on closing price as per October 31, 2018. Maintaining proper stop loss is always recommended.
Written by

Analyst - Investtech
Archive:
31 October: What are investors thinking?
30 October: Bullish on these three stocks
26 October: Three potential candidates to ride on
24 October: Three big Metal stocks, Seasonal variation
22 October: Among top performers on our Top 50 list
18 October: Three stocks investors should stay away from
17 October: Flowing against the tide
16 October: Positive on these 2 stocks
11 October: Over 45 per cent rise
9 October: The Indian banking space
5 October: Nifty closes at a crucial level
2 October: Price formations in the long-term charts
28 September: Positive on Biocon Limited
"Investtech analyses the psychology of the market and gives concrete trading suggestions every day."

Partner & Senior Advisor - Investtech


Investtech guarantees neither the entirety nor accuracy of the analyses. Any consequent exposure related to the advice / signals which emerge in the analyses is completely and entirely at the investors own expense and risk. Investtech is not responsible for any loss, either directly or indirectly, which arises as a result of the use of Investtechs analyses. Details of any arising conflicts of interest will always appear in the investment recommendations. Further information about Investtechs analyses can be found here disclaimer.
The content provided by Investtech.com is NOT SEC or FSA regulated and is therefore not intended for US or UK consumers.
Head office
Strandveien 171366 Lysaker, Norway
Research department
Instituttveien 102007 Kjeller, Norway