
 Oslo Børs
 Stockholmsbörsen
 Københavns Fondsbørs
Investeringsforeninger
Københavns Fondsbørs
Investeringsforeninger
 Helsingin pörssi
 World Indices
 US Stocks
US 30
Nasdaq 100
US 500
US Stocks
US 30
Nasdaq 100
US 500
 Toronto Stock Exchange
 London Stock Exchange
 Euronext Amsterdam
 Euronext Brussel
 DAX
SDAX
TECDAX
Frankfurt
CDAX
MDAX
Prime Standard
DAX
SDAX
TECDAX
Frankfurt
CDAX
MDAX
Prime Standard
 CAC 40
 Mumbai S.E.
National S.E.
Mumbai S.E.
National S.E.
 Commodities
 Currency
 Cryptocurrency
 Exchange Traded Funds
 Investtech Indices
Exclusive research report: Rectangles and return from breakouts
Published April 24, 2019
In technical analysis there are only two independent factors, price and volume, that can be studied on their own. Now in price itself can be found many patterns that can be used as a good entry or exit tool. And to accompany such patterns, volume is another factor that one must not forget at any point. Volume reflects the quality of the breakout, if there is overweight of buyers or sellers.
A rectangle formation is one of the most popular and easy to identify price patterns that are created when buyers and sellers of the stock are balanced over time. In other words, one can say there is indecisiveness among investors and traders as to which way the price should move. Hence a sideways move.

Figure 1: Buy signal from rectangle formation.

Figure 2: Sell signal from rectangle formation.
Technical analysis theory suggests that investor psychology is about to change when the price breaks out from such formations. Such breakouts are considered stronger if they are accompanied by a surge in volume whether its a buy or a sell signal. Target from the formation (as shown in the image below) is the height of the formation projected from the point of breakout/breakdown.
Figure 3: A stock develops a rectangle formation when the price moves sideways between a support line and a resistance line. If the price breaks up from the rectangle, it triggers a buy signal, and according to technical analysis theory the stock price will rise at least as much as the height of the formation. If the price breaks downwards, it triggers a sell signal, and the stock price will fall accordingly.
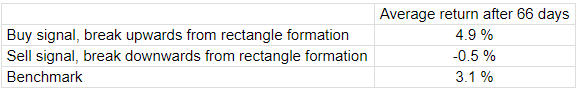
Background and outcome: A report based on 12 years of data from the National Stock Exchange in India shows that stocks with buy signal (3,717 buy signals identified) from rectangle formations on average have risen by 4.9 per cent after three months, while stocks with sell signal (3,004 sell signals identified) from rectangle formations have fallen 0.5 per cent. There is an excess return of 1.8 percentage points compared to benchmark, which on average increased by 3.1 per cent.
Below is the graph that shows results from Investtech's automatic algorithms in medium term charts. The signals are triggered on day 0. Only days when the exchange is open are included, so 66 days equal approximately 3 months. Buy signals are the blue line and the sell signals are the red one. The shaded areas show the standard deviation for these calculations. The black line is the benchmark index.
Rectangle formations and average benchmark
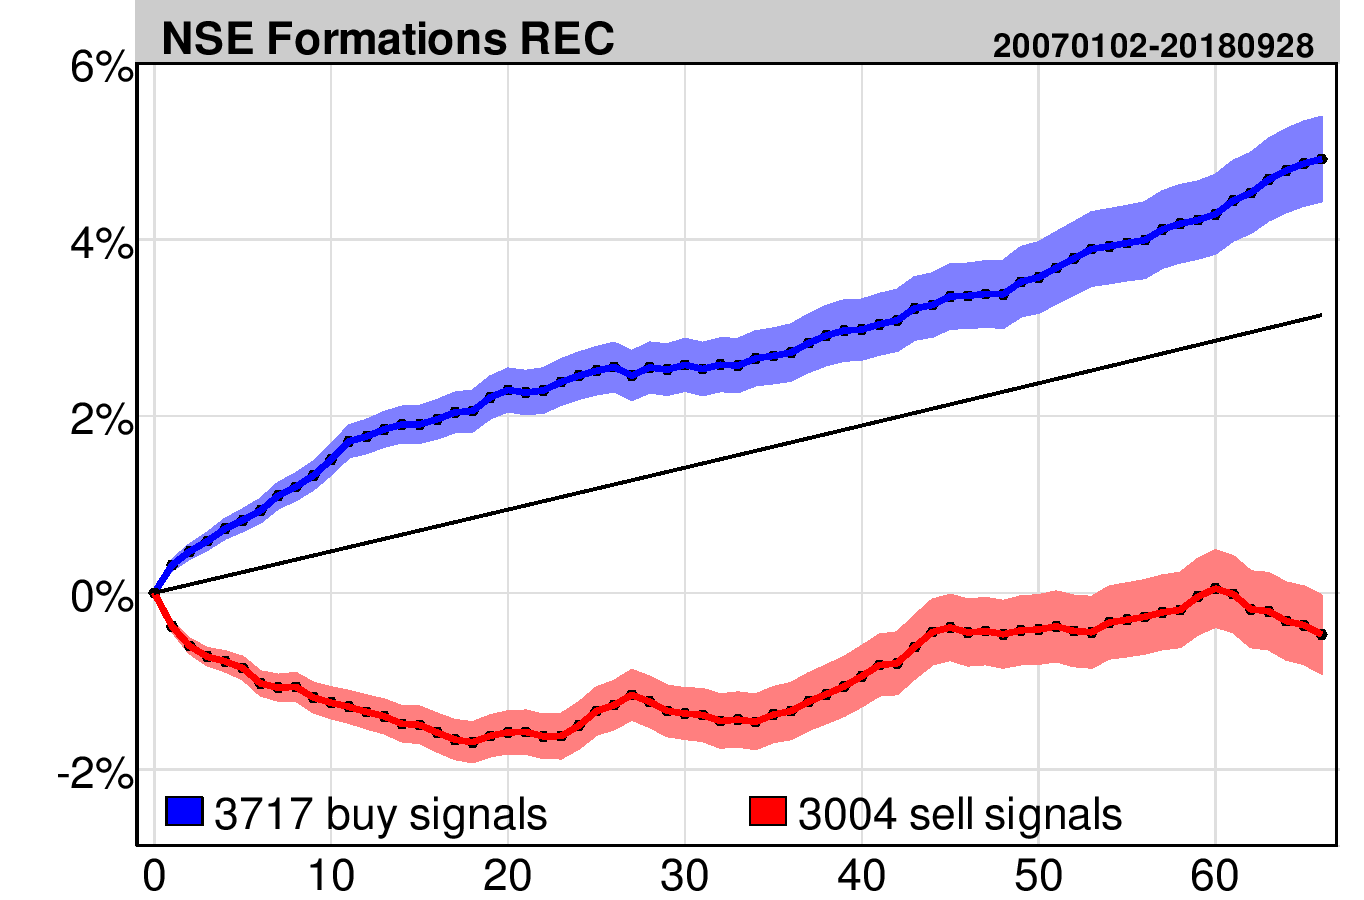
Figure 4: Average price development first 66 days after stocks triggered buy signal (blue) and sell signal (red) from rectangle formations in Investtech's medium long term technical charts. Average benchmark development is the black line. Click the chart for bigger version.
Annualized return: The table below shows annualized return and excess return in percentage points (%p). Annualized return is calculated by repeating the 66 day return four times. Excess return is calculated by subtracting average 66 day return of benchmark index four times. Buy signals gave an annualized excess return of 8.0 percentage points, while sell signals gave negative returns of 15 percentage points with respect to the benchmark Nifty 50 index.
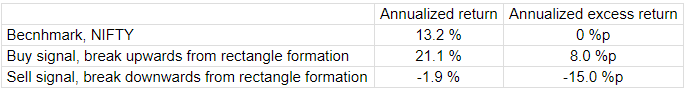
%p: percentage points
Our opinion: Based on historical prices for stocks on the National Stock Exchange in the period 2007 to 2018, stocks with buy signals from rectangle formations have clearly outperformed benchmark the following three months. Similarly, stocks with sell signals from rectangle formations have underperformed.
Complete report available here.
As you navigate through our menu on the Indian page of our website, you can click on 'signals' and choose between positive or negative stocks, breakouts from different price formations and different time frames. This will give you an overview of stocks that match with your preset criteria.
On the same note we now analyze two stocks that have recently given breakout from rectangle formations.
ABB India Limited (ABB.NS) Close: 372.20
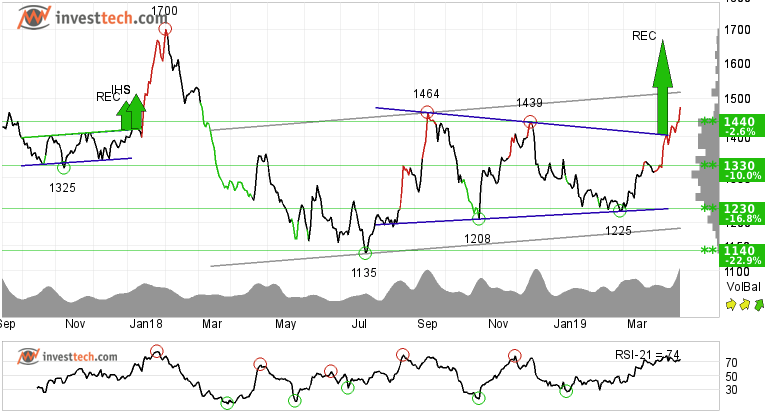
ABB India Limited is within an approximate horizontal trend channel in the medium and long term. The stock has given a buy signal via a breakout from a rectangle formation and closing above the resistance of 1440 rupees. Further rise to 1669 or more is signalled. On the downside there is support between 1440 and 1330.
The breakout in price was accompanied by a rise in volume. This suggests that more people were interested to buy the stock and did not want to be left behind. In addition, RSI is above 70 after a good price increase the past weeks. The stock has strong positive momentum and further increase is indicated. The stock is overall assessed as technically positive for the medium term.
Recommendation one to six months: Positive
Motilal Oswal Financia (MOTILALOFS.NS) Close: 1057.95
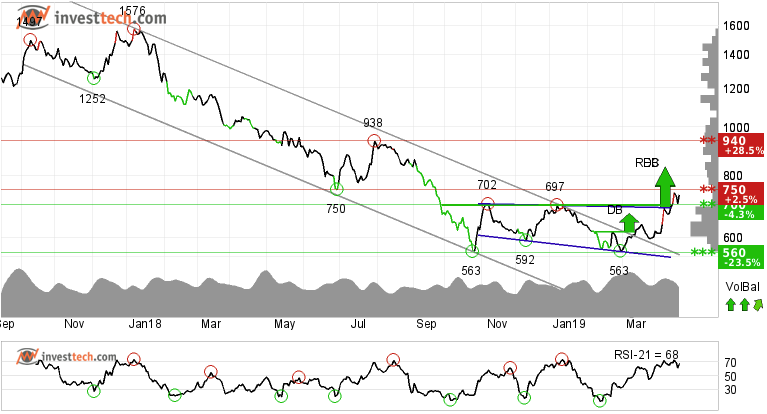
Motilal Oswal Financial Services Limited has broken through the ceiling of a falling trend channel in the medium and long term. The stock has given a positive signal from a rectangle formation by a break up through the resistance at 690. Further rise to 832 or more is signalled. The stock is between the support at rupee 700 and the resistance at rupee 750. A definitive break through of one of these levels predicts the new direction.
RSI is above 70 after a good price increase the past weeks. The stock has strong positive momentum and further increase is indicated. The RSI curve shows a rising trend and the volume balance indicator is also positive. Combined these indicators support the positive trend. The stock is overall assessed as technically positive for the medium term.
Recommendation one to six months: Positive
We will be publishing a similar report by the end of this week for stocks in rising and falling trend for NSE listed stocks, and how much return they have given in the coming three and twelve months.
The analyses are based on closing price as per April 23, 2019. Maintaining proper stop loss is always recommended.
Written by

Analyst - Investtech
Archive:
17 April: Stock with 20 per cent upside potential
11 April: Three buy opportunities, price-volume breakout
29 March: Two stocks to stay from
27 March: Recent breakouts in three stocks, short term opportunity
21 March: Three buy and one sell
12 March: Cement stocks are posing good opportunity
08 March: Clear breakout and reversal from intermediate downtrend
07 March: Deepak Nitrite Limited looks promising to enter into a trade
06 March: Three buy candidates for medium to long term
28 February: Breakout in these three stocks invites for early opportunity
26 February: Two buy opportunities for the near term future
21 February: Stocks with RSI above 70, based on our research
19 February: Close to selling point, time to be cautious
15 February: These two sugar stocks look promising
14 February: Three short to medium term opportunities
08 February: One buy and one sell in stocks while index suggests caution
06 February: One buy and one sell, short to medium term opportunities
01 February: Upside breakout from price formations
30 January: Buying opportunity: Reversing from trend channel support
9 January: One positive and one to stay away from
2 January: A good investment opportunity
2018
21 December: Good buying opportunities
14 December: Positive on these three stocks
11 December: One buy and one sell signal
07 December: Sell Signals in Three Big Stocks
04 December: Highest scorer of our Top 50 list
30 November: Positive stocks with 5-11 per cent upside potential
28 November: Buy signal on high volume
27 November: One Buy and One Sell Signal
23 November: Fear dominates these stocks
21 November: Sell signal, time to stay away
20 November: Early opportunity from short term buy signal?
16 November: Two Buy Signals and One Sell Signal
15 November: Buy signal in this one
13 November: Big auto stocks comparison
09 November: What to wait for?
06 November: Banking stocks look positive
02 November: Positive on this one
01 November: TECHM, NIFTY50 and Hausse
31 October: What are investors thinking?
30 October: Bullish on these three stocks
26 October: Three potential candidates to ride on
24 October: Three big Metal stocks, Seasonal variation
22 October: Among top performers on our Top 50 list
18 October: Three stocks investors should stay away from
17 October: Flowing against the tide
16 October: Positive on these 2 stocks
11 October: Over 45 per cent rise
9 October: The Indian banking space
5 October: Nifty closes at a crucial level
2 October: Price formations in the long-term charts
28 September: Positive on Biocon Limited
"Investtech analyses the psychology of the market and gives concrete trading suggestions every day."

Partner & Senior Advisor - Investtech


Investtech guarantees neither the entirety nor accuracy of the analyses. Any consequent exposure related to the advice / signals which emerge in the analyses is completely and entirely at the investors own expense and risk. Investtech is not responsible for any loss, either directly or indirectly, which arises as a result of the use of Investtechs analyses. Details of any arising conflicts of interest will always appear in the investment recommendations. Further information about Investtechs analyses can be found here disclaimer.
The content provided by Investtech.com is NOT SEC or FSA regulated and is therefore not intended for US or UK consumers.
Head office
Strandveien 171366 Lysaker, Norway
Research department
Instituttveien 102007 Kjeller, Norway