
 Oslo Børs
 Stockholmsbörsen
 Københavns Fondsbørs
Investeringsforeninger
Københavns Fondsbørs
Investeringsforeninger
 Helsingin pörssi
 World Indices
 US Stocks
US 30
Nasdaq 100
US 500
US Stocks
US 30
Nasdaq 100
US 500
 Toronto Stock Exchange
 London Stock Exchange
 Euronext Amsterdam
 Euronext Brussel
 DAX
SDAX
TECDAX
Frankfurt
CDAX
MDAX
Prime Standard
DAX
SDAX
TECDAX
Frankfurt
CDAX
MDAX
Prime Standard
 CAC 40
 Mumbai S.E.
National S.E.
Mumbai S.E.
National S.E.
 Commodities
 Currency
 Cryptocurrency
 Exchange Traded Funds
 Investtech Indices
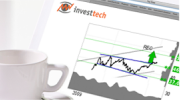
Reaction back to support after buy signal from a formation
A buy signal from a price formation indicates increasing optimism and further rise for the stock. The price has now reacted back in the short term and there is an opportunity for a good entry price by buying just above the formation support.
Theory: When a price formation is broken, this often means the psychology of the market actors taken as a whole is in a special mode. This can for example be that many are sorry they did not buy earlier, or that many are sorry they sold too early. In general, we can say that when a resistance level is broken, all sellers who were on this level(perhaps due to fundamental reasons) are gone. So, the sell side is gone, while the buy side is still there. When a buy signal from a formation is given, this then often causes the price to rapidly rise further. It may then be difficult to buy at a good price. Sometimes, however, there is a reaction back after a formation break. This gives buyers a new chance to get in on the stock, and this time to a good price. It is also possible to invest with a low risk if one sets stop loss just below the support from the formation.
Score: With ideal trading opportunities like this, the price has almost, but not completely, reached the price target of the formation and has then reacted back to a level relatively close to the support from the formation. A lower score is given if the price already has reached the price target before it reacts back. A high quality of the formation, meaning that the formation is very similar to a theoretically perfect formation, results in a high score. The size and age of the formation, meaning how long ago it was broken, also contribute to the score. Volume balance and correlation between volume tops and price tops are also important for calculation of the score. If the price has been below the support line after the break, this is seen as negative. It is also negative if other formations have been formed after the break.
Buying price: Is set to the support of the formation and a little up (about 20 % of the height of the formation).
Price target: Is set to 90-125 % of the price target from the break of the formation.
Stop loss: Is set to 20 % of the height of the formation below the signal level of the formation, i.e. 20 % below the support of the formation.
Time horizon: From 30 % to 60 % of the formation's length. The same percentage is used for all types of formations, even though the signals from rectangles are reached quicker than signals from double-bottom formations and inverse head-and-shoulder formations.

Investeringsaanbevelingen worden gedaan door Investtech.com AS ("Investtech"). Investtech garandeert geen volledigheid of juistheid van de analyses. Eventuele fouten in de aanbevelingen, koop- en verkoopsignalen en mogelijke negatieve gevolgen hiervan zijn geheel het risico van de belegger. Investtech neemt geen enkele verantwoordelijkheid voor verlies, direct of indirect, als gevolg van het gebruik van Investtechs analyses. Meer informatie omtrent Investtechs analyses kunt u vinden op disclaimer.
Investeringsaanbevelingen worden gedaan door Investtech.com AS ("Investtech"). Investtech garandeert geen volledigheid of juistheid van de analyses. Eventuele fouten in de aanbevelingen, koop- en verkoopsignalen en mogelijke negatieve gevolgen hiervan zijn geheel het risico van de belegger. Investtech neemt geen enkele verantwoordelijkheid voor verlies, direct of indirect, als gevolg van het gebruik van Investtechs analyses. Meer informatie omtrent Investtechs analyses kunt u vinden op disclaimer.
Hoofdkantoor
Strandveien 171366 Lysaker, Norway
Research-afdeling
Instituttveien 102007 Kjeller, Norway