
 Oslo Børs
 Stockholmsbörsen
 Københavns Fondsbørs
Investeringsforeninger
Københavns Fondsbørs
Investeringsforeninger
 Helsingin pörssi
 World Indices
 US Stocks
US 30
Nasdaq 100
US 500
US Stocks
US 30
Nasdaq 100
US 500
 Toronto Stock Exchange
 London Stock Exchange
 Euronext Amsterdam
 Euronext Brussel
 DAX
SDAX
TECDAX
Frankfurt
CDAX
MDAX
Prime Standard
DAX
SDAX
TECDAX
Frankfurt
CDAX
MDAX
Prime Standard
 CAC 40
 Mumbai S.E.
National S.E.
Mumbai S.E.
National S.E.
 Commodities
 Currency
 Cryptocurrency
 Exchange Traded Funds
 Investtech Indices
Global stocks: Two buy and two sell from Top 50 candidates
Published October 09, 2019
We are taking a detour from US stocks and focusing on British stocks today. As usual, it is not that easy to find good candidates to trade or invest in, but the beauty of Investtech's in-house created system of algorithms is that it does make the work very easy for you. For today, what I did was go through the Top 50 list of stocks, both buy and sell candidates. And you must not trust me blindly when I say that I found all my candidates within the Top 50 list. You must see for yourself that some of the best trading/investment opportunities were hiding in that list.
Then you would ask how does it work. It's simple! The algorithms created by Investtech go through all the stocks for all the markets that we cover. They then look at the price position with respect to the trend channel, any price formations developing or breakouts from the formations, nearness of price to support or resistance, volume development and the momentum indicator RSI. Then the algorithms allocate points to every stock within the range of -100 to +100. The best and the worst 50 performers on both sides make up the list. Below are analyses for what can prove themselves to be good opportunities in the current market, and I made sure that they are liquid enough to get in and out of the share.
Pennon Group PLC (PNN.L) Close: 805.40
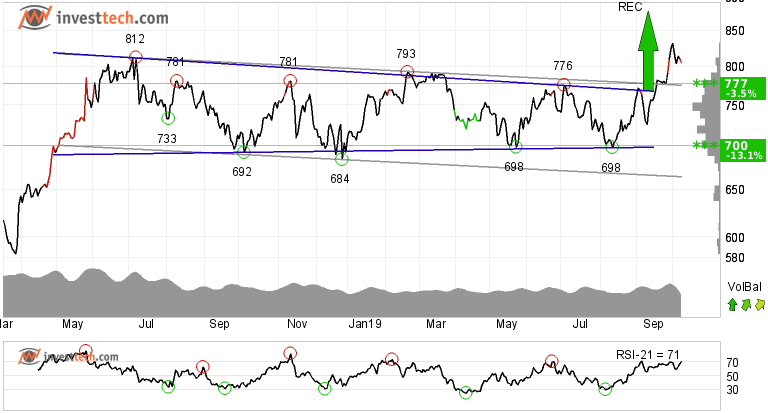
Pennon Group PLC broke up through an approximate horizontal trend channel both in the medium and long term. It also gave positive signal from a rectangle formation by breaking up through the resistance at 768 pence. Further rise to 879 or more is signalled. The medium term chart does not show any clear resistance, while there is resistance around 900 pence in the long term. In case of any price reaction, there is support around 777 pence.
Positive volume balance shows that volume is higher on days with rising prices than days with falling prices. The short term momentum of the stock is strongly positive, with RSI above 70. This indicates increasing optimism among investors and further price increase for Pennon Group PLC.
Investtech's outlook (one to six months): Positive
TUI AG (TUI.L) Close: 904.00
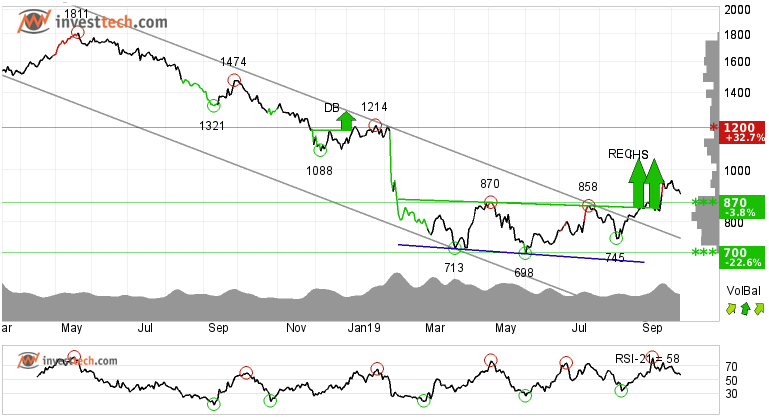
TUI AG has broken up through the falling trend channel that stretched back since the beginning of 2018. The stock has recently given a buy signal from two price formations; an inverse head and shoulders and a rectangle formation. In the long term, a buy signal is initiated from an inverse head and shoulders formation. This breakthrough has come around 849 pence, and further rise to 1052 or more is signalled. Next resistance is around 1200 pence and support is at 870 pence.
Talking about the short term momentum, it is strong and positive. The volume balance indicator suggests that more and more investors are coming in when the stock price goes up and fewer people are selling when the price is correcting downwards. This is a sign of strength and strengthens the price breakout. The stock is overall assessed as technically positive in the medium term.
Investtech's outlook (one to six months): Positive
SSP Group Plc (SSPG.L) Close: 612.00
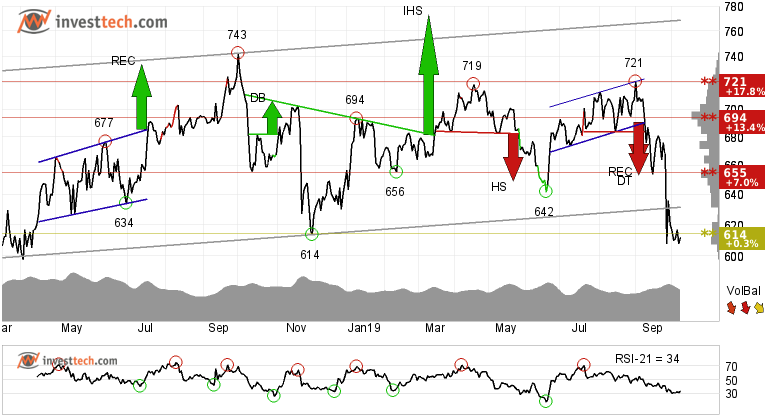
An approximate horizontal trend channel both in the medium and long term charts is broken downwards in SSP Group Plc. A continued weak development is indicated, and the stock now meets resistance on possible reactions up towards the trend lines. The stock has also given a sell signal from a head and shoulders formation and a rectangle formation in the long term chart. Further fall to 521 or lower is signalled.
The stock has now broken the support at 655 in the medium term and 620 in the long term. These levels should now act as potential resistance in case of any price reaction on the upside. On the other hand, there is no clear support in the medium term. However, the long term chart does not suggest any support before 325 pence.
The volume balance is strongly negative, which strengthens the trend break. It indicates that more and more sellers are selling the stock when prices are falling because of the fear of being left behind and sitting with their share of stock if the stock corrects further down. The RSI curve shows a falling trend, which could be an early signal of the start of a falling trend for the price. The stock is overall assessed as technically negative for the medium to long term.
Investtech's outlook (one to six months): Negative
Whitbread PLC (WTB.L) Close: 3988.00
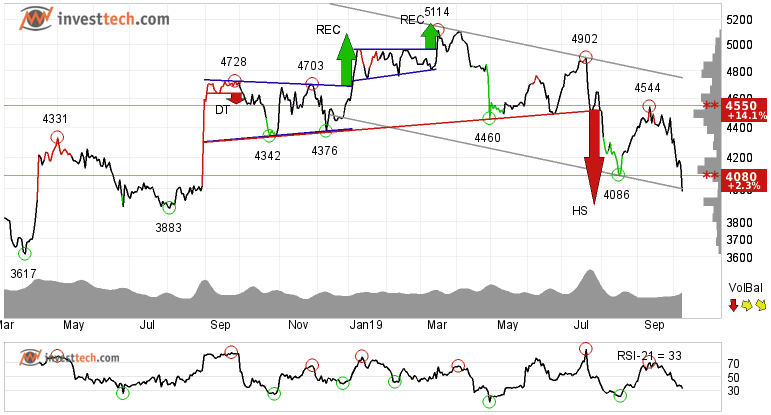
Whitbread PLC has broken down through the falling trend channel in the medium long term. This signals an even stronger falling rate. The stock gave a sell signal from a head and shoulders formation in late July this year. The price objective of 3900 pence is not too far from its current price, but the price formation in general suggest further price development in the same direction.
The stock has resistance between 4080 and 4220 pence in the short term, while support is around 3400 pence in the long term chart. Hence, the risk reward is very favourable.
The short term volum balance indicator is negative. The momentum indicator is in a falling tendency and indicates that more and more investors are getting pessimistic about the stock. This weakens the stock further. The stock is overall assessed as technically negative in the medium term.
Investtech's outlook (one to six months): Negative
The analyses are based on closing price as per October 8, 2019.
These instruments are traded in currency based on the Exchange or country they are listed on.
Geschreven door

Analist
in Investtech
"Investtech analyseert de psychologie in de markt en geeft u iedere dag concrete trading-voorstellen."

Partner & Senior Advisor - Investtech


Investeringsaanbevelingen worden gedaan door Investtech.com AS ("Investtech"). Investtech garandeert geen volledigheid of juistheid van de analyses. Eventuele fouten in de aanbevelingen, koop- en verkoopsignalen en mogelijke negatieve gevolgen hiervan zijn geheel het risico van de belegger. Investtech neemt geen enkele verantwoordelijkheid voor verlies, direct of indirect, als gevolg van het gebruik van Investtechs analyses. Meer informatie omtrent Investtechs analyses kunt u vinden op disclaimer.
Investeringsaanbevelingen worden gedaan door Investtech.com AS ("Investtech"). Investtech garandeert geen volledigheid of juistheid van de analyses. Eventuele fouten in de aanbevelingen, koop- en verkoopsignalen en mogelijke negatieve gevolgen hiervan zijn geheel het risico van de belegger. Investtech neemt geen enkele verantwoordelijkheid voor verlies, direct of indirect, als gevolg van het gebruik van Investtechs analyses. Meer informatie omtrent Investtechs analyses kunt u vinden op disclaimer.
Hoofdkantoor
Strandveien 171366 Lysaker, Norway
Research-afdeling
Instituttveien 102007 Kjeller, Norway