
 Oslo Børs
 Stockholmsbörsen
 Københavns Fondsbørs
Investeringsforeninger
Københavns Fondsbørs
Investeringsforeninger
 Helsingin pörssi
 World Indices
 US Stocks
US 30
Nasdaq 100
US 500
US Stocks
US 30
Nasdaq 100
US 500
 Toronto Stock Exchange
 London Stock Exchange
 Euronext Amsterdam
 Euronext Brussel
 DAX
SDAX
TECDAX
Frankfurt
CDAX
MDAX
Prime Standard
DAX
SDAX
TECDAX
Frankfurt
CDAX
MDAX
Prime Standard
 CAC 40
 Mumbai S.E.
National S.E.
Mumbai S.E.
National S.E.
 Commodities
 Currency
 Cryptocurrency
 Exchange Traded Funds
 Investtech Indices
Investtech Research: Excess return after break upwards from rising trend
Published March 3, 2020
New research from Investtech shows that stocks breaking upwards from medium term rising trends on average have risen 5.9 per cent in three months. The research results largely confirm technical analysis theory, which states that breaks upwards from rising trends give greater rates of increase.
Trends are one of the most important elements of technical analysis. They are visual and intuitive and describe in which direction a stock is moving. According to technical analysis theory, stocks within a rising trend will continue to rise. A rising trend indicates lasting and increasing optimism among investors, often as a result of a great deal of positive news about the stock.
The trend gives the rising rate of the stock price, and the stock's price target is found by extrapolating trend lines. We distinguish between rising trends, horizontal trends and falling trends. More information on trends and how Investtech identifies different trends can be found here.
Investtech's algorithms identify trend breaks for you. A current example may be New York Times Co., which has broken upwards from a medium term rising trend per March 2nd.
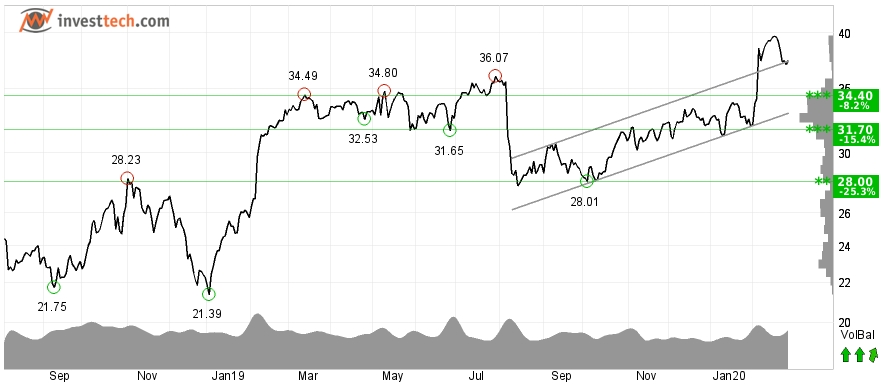
Figure 1:New York Times Co. (NYT.US) Close: 37.27 (-0.19), Mar 2, 2020
Our subscribers can find stocks with these positive signals using for instance the tool Trend signals.
We wanted to study the statistical results yielded by buy signals from breaks upwards from rising trends and therefore studied return from Norwegian, Swedish, Danish and Finnish stocks following buy and sell signals from breaks upwards from rising trends and breaks downwards from falling trends identified in Investtechs price charts in the short, medium and long term. We had up to 23 years of data, from 1996 to 2018. We defined a buy signal as the first day a stock entered a rising trend, or when the stock was in a rising trend and it had been more than 22 days since the previous signal.
The chart below shows average price development following buy signals from breaks upwards from rising trends identified in Investtechs medium term price charts in the Nordic markets. The signals are triggered on day 0. Only days when the exchange is open are included, so 66 days equal approximately three months. The thick blue line shows the development of buy signal stocks. The shaded areas are the standard deviation of the calculations. The thin blue line shows benchmark development in the same period as the buy signal stocks.
Figure 2: Buy signal from rising trend, medium term, the Nordic markets combined.
Stocks breaking upwards from short term rising trends rose 2.4 per cent in the next month. Compared to benchmark in the same period, stocks breaking upwards from rising trends did 1.3 percentage points better, which equals an annualised excess return of 17.5 percentage points.
Stocks breaking upwards from medium term rising trends rose 5.9 per cent in the next three months. Compared to benchmark in the same period, stocks breaking upwards from rising trends did 2.8 percentage points better, which equals an annualised excess return of 12 percentage points.
Stocks breaking upwards from long term rising trends rose 4.6 per cent in the next three months. Compared to benchmark in the same period, stocks breaking upwards from rising trends did 2 percentage points better, which equals an annualised excess return of 8.6 percentage points.
The results are consistent across all four markets and show that stocks breaking upwards from a rising trend continued to rise and outperformed both the trend and benchmark in the next three months.
The time period for the study is fairly long, the data quality is considered to be good and the algorithms used are entirely automatic. Statistical measures suggest a high degree of significance.
There is high likelihood that trend signals will give good indications of how stocks will develop also in the future. Stocks breaking upwards from rising trends are statistically expected to outperform benchmark.
Please find more details and results in the research reports here:
Break in trend direction, short term
Break in trend direction, medium term
Break in trend direction, long term
Keywords: h_TRBrU,help topic main report.
Geschreven door

Analist
in Investtech
Related articles:
Negative excess return after breaks downwards from falling trends
Excess return from stocks in rising trends
Negative excess return from stocks in falling trends
Insight & skills:
"Investtech analyseert de psychologie in de markt en geeft u iedere dag concrete trading-voorstellen."

Partner & Senior Advisor - Investtech


Investeringsaanbevelingen worden gedaan door Investtech.com AS ("Investtech"). Investtech garandeert geen volledigheid of juistheid van de analyses. Eventuele fouten in de aanbevelingen, koop- en verkoopsignalen en mogelijke negatieve gevolgen hiervan zijn geheel het risico van de belegger. Investtech neemt geen enkele verantwoordelijkheid voor verlies, direct of indirect, als gevolg van het gebruik van Investtechs analyses. Meer informatie omtrent Investtechs analyses kunt u vinden op disclaimer.
Investeringsaanbevelingen worden gedaan door Investtech.com AS ("Investtech"). Investtech garandeert geen volledigheid of juistheid van de analyses. Eventuele fouten in de aanbevelingen, koop- en verkoopsignalen en mogelijke negatieve gevolgen hiervan zijn geheel het risico van de belegger. Investtech neemt geen enkele verantwoordelijkheid voor verlies, direct of indirect, als gevolg van het gebruik van Investtechs analyses. Meer informatie omtrent Investtechs analyses kunt u vinden op disclaimer.
Hoofdkantoor
Strandveien 171366 Lysaker, Norway
Research-afdeling
Instituttveien 102007 Kjeller, Norway