
 Oslo Børs
 Stockholmsbörsen
 Københavns Fondsbørs
Investeringsforeninger
Københavns Fondsbørs
Investeringsforeninger
 Helsingin pörssi
 World Indices
 US Stocks
US 30
Nasdaq 100
US 500
US Stocks
US 30
Nasdaq 100
US 500
 Toronto Stock Exchange
 London Stock Exchange
 Euronext Amsterdam
 Euronext Brussel
 DAX
SDAX
TECDAX
Frankfurt
CDAX
MDAX
Prime Standard
DAX
SDAX
TECDAX
Frankfurt
CDAX
MDAX
Prime Standard
 CAC 40
 Mumbai S.E.
National S.E.
Mumbai S.E.
National S.E.
 Commodities
 Currency
 Cryptocurrency
 Exchange Traded Funds
 Investtech Indices
Investtech Research: Investtech Indices - results 2022-2023
Published May 25th, 2023.
By: Head of Research Geir Linløkken, Investtech.
Abstract:
Investtech launched the Investtech Indices in April last year. This is the first research article based on the indices. We examine how factors such as trend status, insider trading, and liquidity have contributed to returns over the past year. The main conclusion is that rising trends, positive technical scores, and insider buying have been associated with excess return in the subsequent period. High-volatility stocks have, as before, significantly underperformed compared to less volatile stocks. Unlike in the past, low-liquidity stocks have shown a significant negative excess return compared to more liquid stocks.
Investtech Indices
Investtech has been updating a range of equally weighted indices for stocks with different technical and quantitative characteristics since April 2022. The idea is that these indices effectively demonstrate the returns one would have obtained by mechanically following quantitative strategies in stock trading. The indices can also indicate the short-term market drivers and what has recently yielded a good "payoff."
The members of each index are fully updated automatically at specified intervals, and returns are calculated automatically on each trading day.
Unlike many market indices, the Investtech Indices are equally weighted. This means that all stocks initially have the same weight, whether they belong to very large or relatively small companies. These indices can serve as good benchmark indices for investors who follow Investtech's analyses and allocate their funds in fairly equal proportions across their portfolios.
Read more about the Investtech Indices here!
Below are the results for all Investtech Indices at the Nordic level. The graphs and tables are as of May 15, 2023.
Investtech Indices for the Nordic markets
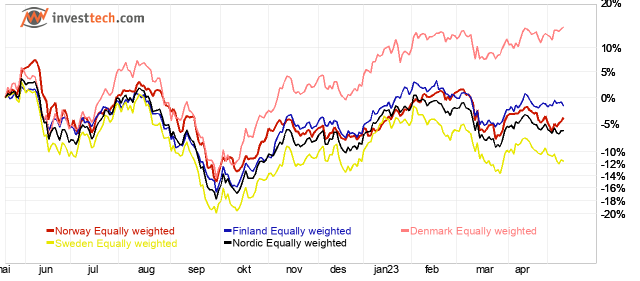
Figure 1a: Equally weighted indices for the Nordic markets. Past year until May 15, 2023.
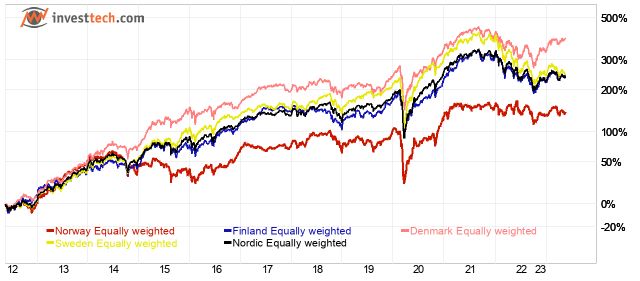
Figure 1b: As above, but past ten years until May 15, 2023.
| Index name | Return past year | Annualised past ten years |
| Norway Equally weighted | -3.7 % | 7.4 % |
| Sweden Equally weighted | -10.8 % | 11.6 % |
| Denmark Equally weighted | 15.5 % | 14.5 % |
| Finland Equally weighted | -1.4 % | 10.6 % |
| Nordic Equally weighted | -4.6 % | 10.9 % |
|---|
Note that the chart for the past year is the past calendar year, whereas the values in the table for the past year are for the past 252 days, which is not quite one calendar year. This may cause a slight difference between the chart and the table.
The equally weighted combined Nordic index will be the benchmark index for all the others. As of May 15 2023, it consists of the 807 Nordic stocks with an average daily turnover above 500,000 NOK. The members of the index are updated quarterly. Each stocks weighs the same to begin with and return is calculated daily.
For the past year, Denmark did best, rising 15.5 per cent. Sweden was weakest, down by 10.8 per cent, while Norway and Finland, as well as the Nordic markets combined, saw a slight decrease.
Investtech Trend Indices
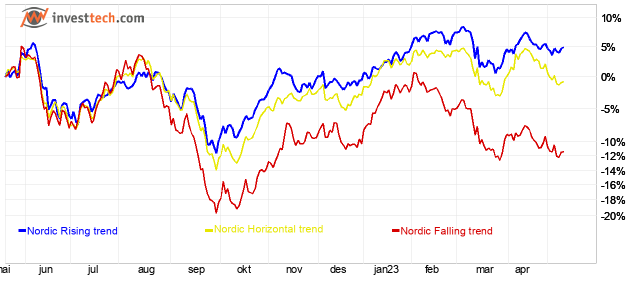
Figure 2a: Investtech Indices for Nordic stocks in rising, falling and horizontal trends. Price development past year until May 15, 2023.
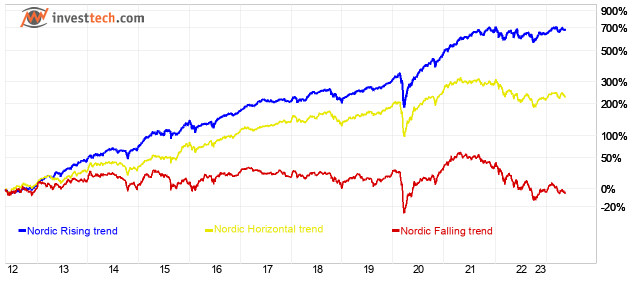
Figure 2b: As above, but past ten years until May 15, 2023.
| Index name | Return past year | Annualised past ten years |
| Nordic Rising trend | 8.1 % | 20.4 % |
| Nordic Horizontal trend | -0.3 % | 11.2 % |
| Nordic Falling trend | -10.6 % | -1.0 % |
Members of the trend indices are updated monthly. Index development one month is determined by the development of the stocks that had the various trend statuses at the end of the previous month.
In the past year, stocks in rising trends have risen 8.1 per cent. This is 12.7 percentage points better than benchmark (Nordic Equally weighted). Stocks in falling trends underperformed, falling 10.6 per cent, equal to 6.0 percentage points weaker than benchmark.
The difference in the past year between stocks in rising trends and in falling trends is a solid 18.7 percentage points. This is in line with the average for the past ten years, which is 21.4 percentage points.
The figures show that trend signals have worked well in the past year.
Investtech Technical Score Indices
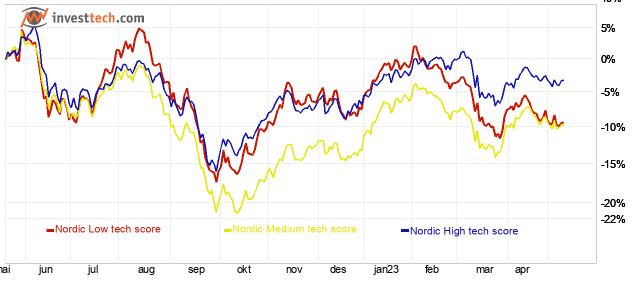
Figure 3a: Investtech Indices for Nordic stocks with high, medium and low technical score, equal to algorithmic medium term positive/weak positive, watch and negative/weak negative recommendation. Price development past year until May 15, 2023.
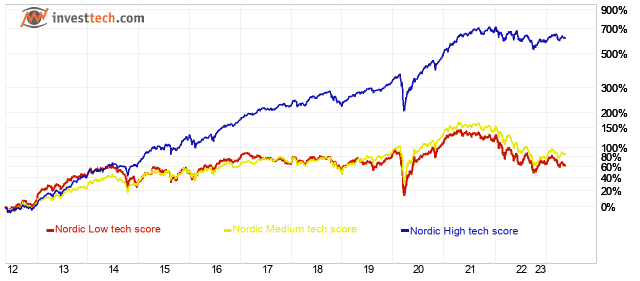
Figure 3b: As above, but past ten years until May 15, 2023.
| Index name | Return past year | Annualised past ten years |
| Nordic High tech score (buy and weak buy) | -0.4 % | 19.7 % |
| Nordic Medium tech score (neutral) | -9.6 % | 5.0 % |
| Nordic Low tech score (sell and weak sell) | -8.3 % | 2.5 % |
In the past year, stocks with high technical score have clearly outperformed stocks with neutral or low technical score. In other words, stocks with positive or weak positive algorithmic recommendations have done better than stocks with neutral or negative recommendations. The difference down to indices for neutral and negative indices is 8-9 percentage points. This is a big gap, but slightly smaller than for the past decade, when the difference was 14-16 percentage points.
The figures show that Investtech's technical score recommendations have worked well in the past year, but not quite as well as for the past ten years.
Investtech Insider Indices
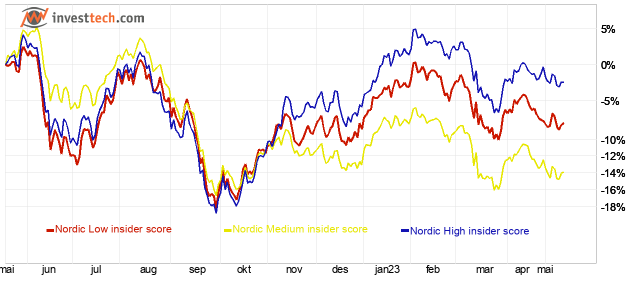
Figure 4a: Investtech Indices for Nordic stocks with high, medium and low insider score, equal to algorithmic medium term positive/weak positive, watch and negative/weak negative recommendation based on insider trades. Price development past year until May 15, 202
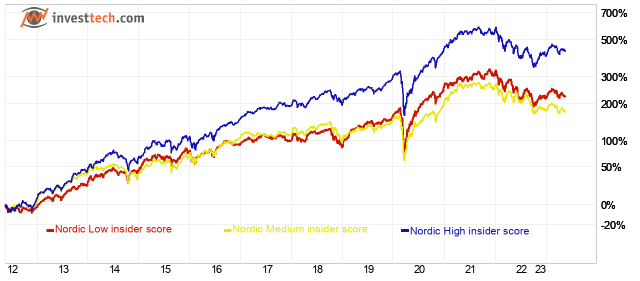
Figure 4b: As above, but past ten years until May 15, 2023.
| Index name | Return past year | Annualised past ten years |
| Nordic High insider score (buy and weak buy) | 2,4 % | 16,1 % |
| Nordic Medium insider score (neutral) | -9.2 % | 8.7 % |
| Nordic Low insider score (sell and weak sell) | -4.1 % | 11.4 % |
There are many more insider purchases than sales in the market, and the insider purchase index has 257 members on May 15, while the insider sales index has 69 members.
In the past year, the index for stocks with high insider score has risen 2.4 per cent, while the one for insider sales has fallen 4.1 per cent. The difference of 6.5 percentage points is slightly larger than it has been the past ten years.
The chart shows that insider purchases have been a good indicator in the past year.
Investtech Volatility Indices
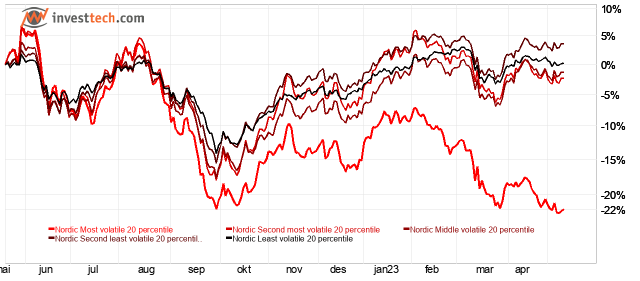
Figure 5a: Investtech indices for Nordic stocks with different volatility, split into five approximately same-sized groups. For instance, the index "Most volatile" is the 20 per cent of stocks that fluctuate the most. Price development is past year until May 15, 2023.
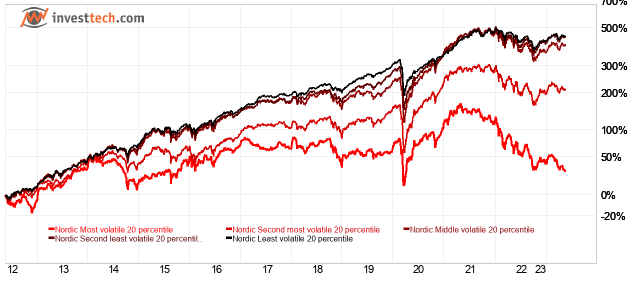
Figure 5b: As above, but past ten years until May 15, 2023.
| Index name | Return past year | Annualised past ten years |
| Nordic Least volatile 20 percentile | 0,2 % | 15,6 % |
| Nordic Second least volatile 20 percentile | 6.1 % | 15.8 % |
| Nordic Middle volatile 20 percentile | -0.2 % | 14.7 % |
| Nordic Second most volatile 20 percentile | -1.1 % | 10.3 % |
| Nordic Most volatile 20 percentile | -20.3 % | 1.8 % |
Stock volatility is a fairly consistent characteristic over time. If a stock fluctuated a lot during a period, it's likely to fluctuate for the next period as well.
There are no surprises here. As before, the group of the most volatile stocks has significantly underperformed. This fifth of the stocks is down 22 per cent. The other groups are all plus/minus zero.
The ten-year-chart shows the effects just as well: the most volatile stocks have performed much weaker than the other groups. However, here the second most volatile stocks have also underperformed.
The chart shows that the most volatile stocks have underperformed in the past year. It can be tempting to buy such stocks, which have often fallen a lot and have high upside, but the indices suggest this is a dangerous strategy. Based on the long term chart, it is considered a wise strategy for long term investors to stay entirely away from the most volatile stocks.
Investtech Liquidity Indices
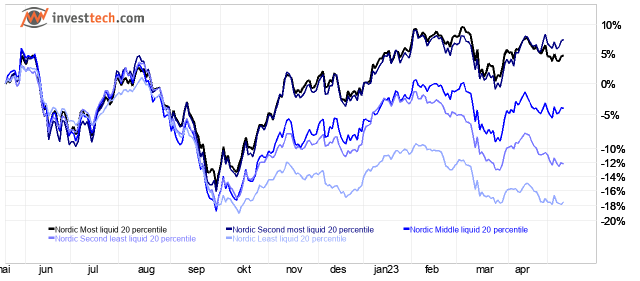
Figure 6a: Investtech indices for Nordic stocks with different liquidity, split into five approximately same-sized groups. For instance, for Norway median liquidity for stocks in the five different indices are 0.9, 2.5, 6.0, 23 and 77 MNOK respectively. Price development past year until May 15, 2023.
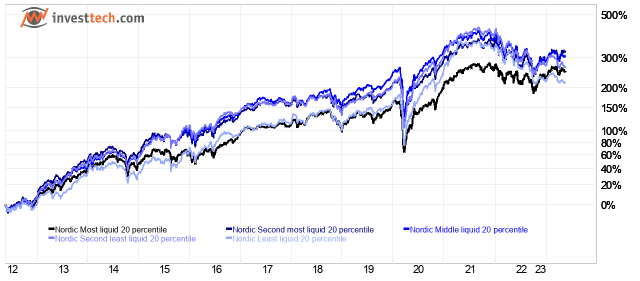
Figure 6b: As above, but past ten years until May 15, 2023.
| Index name | Return past year | Annualised past ten years |
| Nordic Least liquid 20 percentile | -18.1 % | 11.0 % |
| Nordic Second least liquid 20 percentile | -12.0 % | 11.4 % |
| Nordic Middle liquid 20 percentile | -2.8 % | 12.7 % |
| Nordic Second most liquid 20 percentile | 10.7 % | 12.7 % |
| Nordic Most liquid 20 percentile | 9.1 % | 11.5 % |
In the past year, the equally weighted Investtech index for the largest companies in the Nordic region is up around 5 per cent (black curve in the graph). The index for the second largest companies (dark blue curve) is up around 7 per cent, while the two groups of small companies (light blue curves), those traded for between approximately half a million and three million Norwegian kroner per day, are down between 12 and 18 per cent.
Small-cap companies have performed much weaker than large-cap companies in the past 12 months. In the long term, the past ten years, the indices have followed each other closely, and there are only small differences between the groups.
Although small companies have underperformed compared to large companies recently, we should be cautious in believing that this is a persistent change in the market. Rather, we believe that the long term statistics still hold true, and that small companies will again develop in line with the market.
Summary
Trends have continued to be a good indicator of whether stocks will rise or fall. Just as theory and previous statistics have shown, it has been correct to buy stocks in rising trends and sell stocks in falling trends.
Stocks with a high technical score, meaning algorithmic positive recommendations, have performed significantly better in the past year than those with a neutral or negative recommendation.
Insider trading has also been a good indicator, with positive returns in the past year for stocks with insider purchases, while stocks with insider sales or no insider trading have performed negatively.
Very high volatility, which has previously been strongly associated with lower returns, continues to indicate weak performance. The most volatile fifth of the Nordic stocks has underperformed by around 20 percentage points compared to the other four groups in the past year.
Small-cap companies have performed much weaker than large-cap companies in the past year. However, in the long term, there is nothing to suggest that such stocks will continue to underperform.
Conclusion
We conclude that the Indices have largely followed development patterns from previous years, and that Investtech's analyses can provide valuable insights into which stocks to buy, sell, and avoid.
The Investtech Indices and the statistical relationships revealed through them support our strategy underlying Investtech's analyses: Buy stocks that are technically positive, in upward trends, and/or show positive insider trading. Sell correspondingly negative stocks. Completely avoid investing in the most volatile stocks. These are often referred to as "lottery stocks" and have consistently delivered weak returns over time.
Small-cap stocks have underperformed in the recent period, while in the long term, they have performed in line with larger companies. From the signal statistics in our extensive research project from 2021, we saw that small-cap stocks provided stronger technical signals than large-cap stocks, making it potentially easier to achieve excess return in smaller companies. We still consider it favourable to have more small-caps in a portfolio, even though this may result in significant deviation from benchmark in some periods.
Historical results are no guarantee of similar future results. Market conditions may change in the future, and other factors may come into play. However, the statistics and the summary of the Investtech Indices over the past year are considered to confirm previous results and support the notion that these are persistent effects in the markets. Research findings and statistics will continue to play a central role in Investtech's subjective recommendations in morning reports, model portfolios, and other analysis publications.
Geschreven door

Hoofd research en analyse
in Investtech
Investtech Indices:
Overview
Trends
Nordic region | Norway | Sweden | Denmark | Finland
Technical score
Nordic region | Norway | Sweden | Denmark | Finland
Insider trades
Nordic region | Norway | Sweden
Volatility
Nordic region | Norway | Sweden | Denmark | Finland
Liquidity
Nordic region | Norway | Sweden | Denmark | Finland
"Investtech analyseert de psychologie in de markt en geeft u iedere dag concrete trading-voorstellen."

Partner & Senior Advisor - Investtech


Investeringsaanbevelingen worden gedaan door Investtech.com AS ("Investtech"). Investtech garandeert geen volledigheid of juistheid van de analyses. Eventuele fouten in de aanbevelingen, koop- en verkoopsignalen en mogelijke negatieve gevolgen hiervan zijn geheel het risico van de belegger. Investtech neemt geen enkele verantwoordelijkheid voor verlies, direct of indirect, als gevolg van het gebruik van Investtechs analyses. Meer informatie omtrent Investtechs analyses kunt u vinden op disclaimer.
Investeringsaanbevelingen worden gedaan door Investtech.com AS ("Investtech"). Investtech garandeert geen volledigheid of juistheid van de analyses. Eventuele fouten in de aanbevelingen, koop- en verkoopsignalen en mogelijke negatieve gevolgen hiervan zijn geheel het risico van de belegger. Investtech neemt geen enkele verantwoordelijkheid voor verlies, direct of indirect, als gevolg van het gebruik van Investtechs analyses. Meer informatie omtrent Investtechs analyses kunt u vinden op disclaimer.
Hoofdkantoor
Strandveien 171366 Lysaker, Norway
Research-afdeling
Instituttveien 102007 Kjeller, Norway