
 Oslo Børs
 Stockholmsbörsen
 Københavns Fondsbørs
Investeringsforeninger
Københavns Fondsbørs
Investeringsforeninger
 Helsingin pörssi
 World Indices
 US Stocks
US 30
Nasdaq 100
US 500
US Stocks
US 30
Nasdaq 100
US 500
 Toronto Stock Exchange
 London Stock Exchange
 Euronext Amsterdam
 Euronext Brussel
 DAX
SDAX
TECDAX
Frankfurt
CDAX
MDAX
Prime Standard
DAX
SDAX
TECDAX
Frankfurt
CDAX
MDAX
Prime Standard
 CAC 40
 Mumbai S.E.
National S.E.
Mumbai S.E.
National S.E.
 Commodities
 Currency
 Cryptocurrency
 Exchange Traded Funds
 Investtech Indices
Global stocks: Amazon and AT&T(Inc.), where are they heading?
Published September 25, 2019
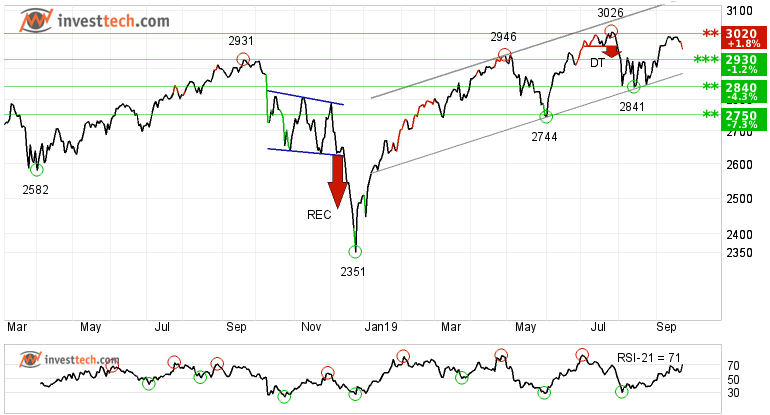
The US markets, along with many other global markets, showed a negative development on Tuesday. S&P 500 ended the day at 2967 points, which is a decline of 0.84 per cent. As seen by the chart below, the broader index is facing resistance around 3020 points and has marginally shied away from this level. However, the momentum indicator speaks of a happy story. RSI is above 70 and is in positive territory, indicating that the majority of investors in the market are positive. In case of a downside reaction, there is support around 2930 and 2840 points.
Talking about our choice of two stocks today, they need no introduction. Both are well established names in their respective areas of expertise. One has been rising consistently since the beginning of the year, while the other has given a negative signal from a rectangle price formation.
AT&T, Inc. (T.US500) Close: 37.38
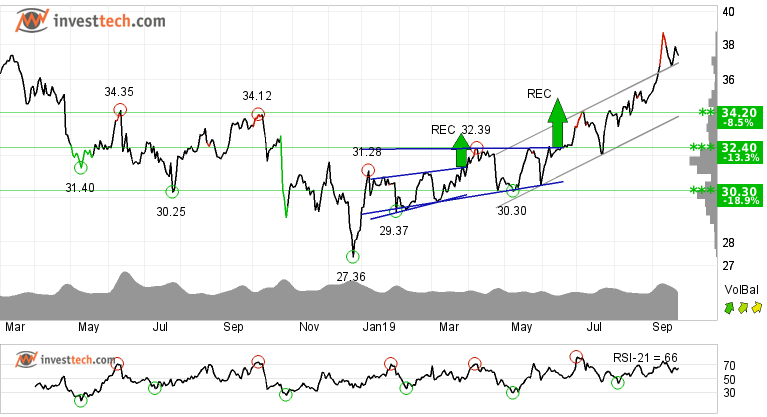
AT&T, Inc. has broken up through the ceiling of the rising trend channel in the medium term, which signals an even stronger rising rate. A lot of research has been done by Investtech in the area regarding position of price with respect to the trend channel, support and resistance and the average return for stocks with respect to the broader index. More about the research can be studied here.
In early June the stock gave a price breakout from a rectangle formation. Even though the target from the price formation has been met, it still indicates a positive price development for the stock. There is resistance around 39.30 dollars in the long term chart where the stock may face some resistance, but not necessarily. On the other hand, the support is around 36.20 and 34.20 dollars in the long and medium term charts respectively.
Talking about the momentum, it is strong and positive. The volume balance indicator suggests that more and more investors are coming in when the stock price goes up and fewer people are selling when the price is correcting downwards. This is a sign of strength and strengthens the underlying trend. The stock is overall assessed as technically positive in the medium term.
Investtech's outlook (one to six months): Positive
Amazon.com (AMZN.US500) Close: 1741.61
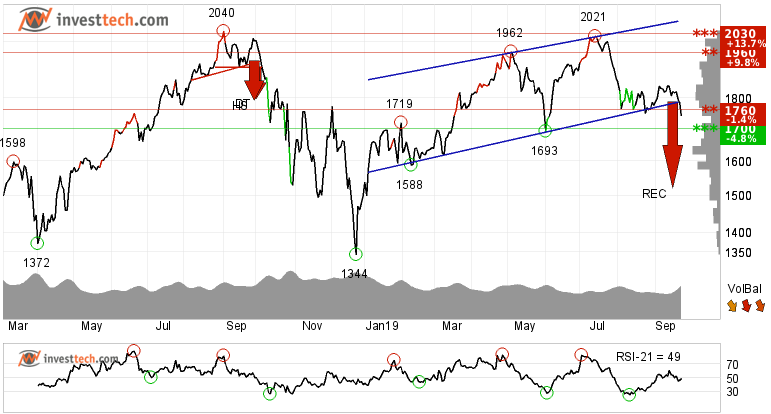
Amazon.com does not show any clear trend in the medium term and has broken the floor of the rising trend channel in the long term. It has now given a negative signal from a rectangle formation as the price has broken down through support at 1787. Further fall to 1520 or lower is signalled.
In early July investors tried to take the price of Amazon close to its previous top of 2040, but lack of buying interest around the top could not induce more buying. Investors failed to take the price into a new high and a strong resistance around the same area has now been established. On the downside there is support around 1700 dollars. However, a break below that level may create panic among investors and hence more selling.
The volume balance is also negative, which strengthens the trend break. It indicates that more and more sellers are selling the stock when prices are falling because of the fear of being left behind and sitting with their share of stock if the stock corrects further down. The RSI curve shows a falling trend, which could be an early signal of the start of a falling trend for the price as well. The stock is overall assessed as technically negative for the medium term.
Investtech's outlook (one to six months): Negative
The analyses are based on closing price as per September 24, 2019.
These instruments are traded in currency based on the Exchange or country they are listed on.
Geschreven door

Analist
in Investtech
"Investtech analyseert de psychologie in de markt en geeft u iedere dag concrete trading-voorstellen."

Partner & Senior Advisor - Investtech


Investeringsaanbevelingen worden gedaan door Investtech.com AS ("Investtech"). Investtech garandeert geen volledigheid of juistheid van de analyses. Eventuele fouten in de aanbevelingen, koop- en verkoopsignalen en mogelijke negatieve gevolgen hiervan zijn geheel het risico van de belegger. Investtech neemt geen enkele verantwoordelijkheid voor verlies, direct of indirect, als gevolg van het gebruik van Investtechs analyses. Meer informatie omtrent Investtechs analyses kunt u vinden op disclaimer.
Investeringsaanbevelingen worden gedaan door Investtech.com AS ("Investtech"). Investtech garandeert geen volledigheid of juistheid van de analyses. Eventuele fouten in de aanbevelingen, koop- en verkoopsignalen en mogelijke negatieve gevolgen hiervan zijn geheel het risico van de belegger. Investtech neemt geen enkele verantwoordelijkheid voor verlies, direct of indirect, als gevolg van het gebruik van Investtechs analyses. Meer informatie omtrent Investtechs analyses kunt u vinden op disclaimer.
Hoofdkantoor
Strandveien 171366 Lysaker, Norway
Research-afdeling
Instituttveien 102007 Kjeller, Norway