De trendbijbel
 Telefoon: 08-517 29 555
 Verstuur e-mail
 Word gebeld
 Bezoek ons
Both short and medium long term trend signals have shown strong predictive power. Long term trends have weaker predictive power and thus focus should be on Investtech’s trends in the short and medium long term charts when conducting an overall analysis of a stock.
Research Results – Time Perspective and Signal Power
Do short term analyses give the best signals in the short term and long term analyses the best signals in the long term? We study statistical return in the short term (22 days), medium long term (66 days) and long term (250 days) following trend signals in the short, medium long and long term charts.
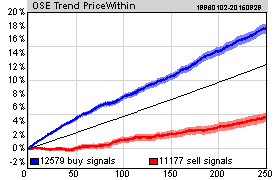
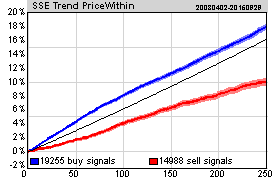
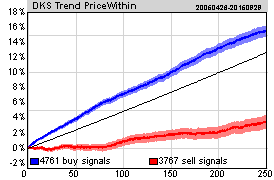
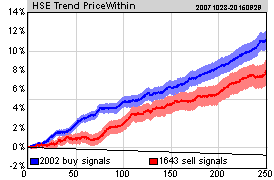
Figure 1: Short term signals, price development the following year. Average price development for stocks in rising and falling trends in Investtech’s short term technical charts.
Figure 2: Medium long term signals, price development the following year. Average price development for stocks in rising and falling trends in Investtech’s medium long term technical charts.
Figure 3: Long term signals, price development the following year. Average price development for stocks in rising and falling trends in Investtech’s long term technical charts.
| Signal power over time. Stocks in rising trends. | |||
| Relative figures, average for the Nordic countries | 22 days - one month | 66 days - one quarter | 250 days - one year |
| Short term | 0.8 ppt | 1.9 ppt | 3.0 ppt |
| Medium long term | 0.8 ppt | 1.8 ppt | 3.3 ppt |
| Long term | 0.4 ppt | 0.8 ppt | 0.5 ppt |
| Signal power over time. Stocks in falling trends. | |||
| Relative figures, average for the Nordic countries | 22 days - one month | 66 days - one quarter | 250 days - one year |
| Short term | -0.9 ppt | -2.2 ppt | -6.9 ppt |
| Medium long term | -1.2 ppt | -2.8 ppt | -8.8 ppt |
| Long term | -0.5 ppt | -1.2 ppt | -3.5 ppt |
ppt: percentage points
The charts and tables above show that both short term and medium long term have shown good predictive power. Especially in the short and medium long term, but also to a lesser extent in the long term. Stocks in rising trends in Investtech’s short and medium long term charts have given an excess return of 0.8 percentage points the first month and 1.8 to 1.9 percentage points the following three months, and 3.0 to 3.3 percentage points the following year. Stocks in falling trends in Investtech’s short and medium long term charts have given negative excess return of 0.9 to 1.2 percentage points the next month, 2.2 to 2.8 percentage points the next three months and 6.9 to 8.8 percentage points the following year.
Signals in short and medium long term analyses give better long term prediction, one year forward, than the signals in the long term charts. Stocks in long term rising trends gave excess return of a marginal 0.5 percentage points vs. benchmark in a year, while stocks in long term falling trends gave a negative excess return of 3.5 percentage points. It is logical that long term signals have weaker short term predictive power, but it was a surprise that they are clearly weaker also in the long term.
This indicates that short and medium long term trends, which tend to cover 20 to 300 days in Investtech’s charts, are close and have low regression deviation, make the best predictions. The long term trends, over 500 to 1000 days, make for weaker predictions.
When doing an overall analysis of a stock, for an investment perspective of one month to a year, the trends in Investtech’s short and medium long term charts should be emphasised and the long term trends disregarded.
Investtechs forskningsarbete baseras på studier av mer än 350.000 signaler från trender
i börsnoterade nordiska aktier från 1996 till 2015.
Praktisk användning - Verktyg - Statistik - Algoritmer - Teori
Trendbibeln - startsida Mer om Investtechs forskning
Trendbibeln är skriven av forskningschef Geir Linløkken under 2016. Forskningsteamet bakom Trendbibeln består av seniorforskarna Asbjørn Taugbøl och Fredrik Tyvand, samt Linløkken själv.
Investtech har arbetat med forskning inom behavioural finance, teknisk och kvantitativ aktieanalys sedan 1997. Företaget har utvecklat ett analyssystem som bland annat identifierar trender, stöd och motstånd, formationer och volymmönster i aktiekurser, och ger köp- och sälj-rekommendationer baserat på detta. Investtech gör omfattande användning av avancerade matematiska algoritmer och tunga statistiska metoder i sina dataprogram och internetbaserade abonnemangstjänster.
Investeringsaanbevelingen worden gedaan door Investtech.com AS ("Investtech"). Investtech garandeert geen volledigheid of juistheid van de analyses. Eventuele fouten in de aanbevelingen, koop- en verkoopsignalen en mogelijke negatieve gevolgen hiervan zijn geheel het risico van de belegger. Investtech neemt geen enkele verantwoordelijkheid voor verlies, direct of indirect, als gevolg van het gebruik van Investtechs analyses. Meer informatie omtrent Investtechs analyses kunt u vinden op disclaimer.
Investeringsaanbevelingen worden gedaan door Investtech.com AS ("Investtech"). Investtech garandeert geen volledigheid of juistheid van de analyses. Eventuele fouten in de aanbevelingen, koop- en verkoopsignalen en mogelijke negatieve gevolgen hiervan zijn geheel het risico van de belegger. Investtech neemt geen enkele verantwoordelijkheid voor verlies, direct of indirect, als gevolg van het gebruik van Investtechs analyses. Meer informatie omtrent Investtechs analyses kunt u vinden op disclaimer.


 Oslo Børs
 Stockholmsbörsen
 Københavns Fondsbørs
 Helsingin pörssi
 World Indices
 US Stocks
 Toronto Stock Exchange
 London Stock Exchange
 Euronext Amsterdam
 Euronext Brussel
 DAX
DAX CAC 40
 Mumbai S.E.
 Commodities
 Currency
 Cryptocurrency
 Exchange Traded Funds
 Investtech Indices