
 Oslo Børs
 Stockholmsbörsen
 Københavns Fondsbørs
Investeringsforeninger
Københavns Fondsbørs
Investeringsforeninger
 Helsingin pörssi
 World Indices
 US Stocks
US 30
Nasdaq 100
US 500
US Stocks
US 30
Nasdaq 100
US 500
 Toronto Stock Exchange
 London Stock Exchange
 Euronext Amsterdam
 Euronext Brussel
 DAX
SDAX
TECDAX
Frankfurt
CDAX
MDAX
Prime Standard
DAX
SDAX
TECDAX
Frankfurt
CDAX
MDAX
Prime Standard
 CAC 40
 Mumbai S.E.
National S.E.
Mumbai S.E.
National S.E.
 Commodities
 Currency
 Cryptocurrency
 Exchange Traded Funds
 Investtech Indices
Candlestick analysis
Candlestick analysis is the best tool for doing a detailed short term volume analysis. Candlesticks help identify signals before they appear in the price chart, as well as assist with short term timing and setting limits. Candlesticks also strengthen or weaken more long term trend signals.
The Candlestick graphs
You switch the candlestick graphs on and off by clicking the ![]() button. The graphs show short term details in the price chart. Opening price, low and high prices are stated in addition to closing price. You can also study volume details and the connection between volume and price changes.
button. The graphs show short term details in the price chart. Opening price, low and high prices are stated in addition to closing price. You can also study volume details and the connection between volume and price changes.
About Candle formation
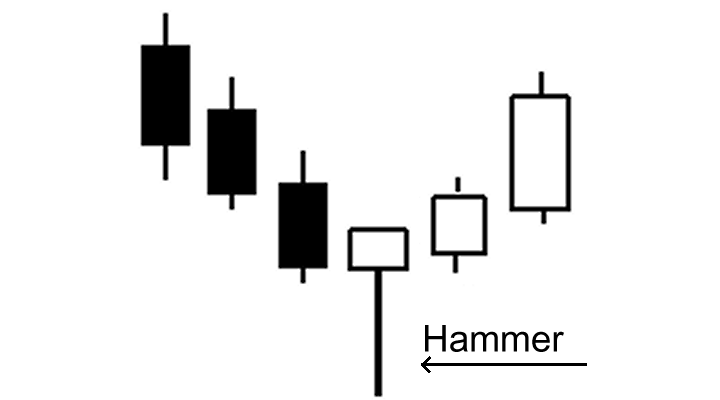
The rectangle section of the candle line is called the Real body. Thin lines above and below the real body are called Shadows. These shadows represent the sessions price extremes. The shadow above the real body is called the upper shadow, and the shadow below is called the lower shadow. Accordingly, the peak is the high of the trading session and the bottom is the low.

When the closing price is higher than the opening, we get a white real body.

When the price closes below the open, we get a black real body.
 Volume is plotted with one column per day. The column is green if the closing price was higher than the day before. It is red if the closing price fell, and blue if there was no change.
Volume analysis with Investtechs candlesticks
In short term volume analysis we study what volume is like on days when the price rises and on days when the price falls. Investtechs candlesticks are very good tools for this analysis, especially due to the colour coded volume columns.
The main rules are:
- Tall green volume columns and low red ones indicate rising prices.
- Tall red volume columns and low green ones indicate falling prices.
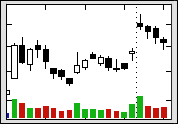
 Positive
High volume on rising prices indicates that optimism is increasing and many investors pay more to acquire stocks. Low volume on falling prices indicates that few investors will reduce the price in order to sell, and that they are comfortable keeping the stock. This is positive and indicates further rise.
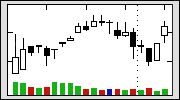
 Negative
High volume on falling prices indicates that uncertainty is on the increase and that many investors will reduce the price in order to get rid of their stocks. Low volume on rising prices indicates that few investors will pay more to be able to acquire the stock, and that they are not very interested or they assume they will be able to get the stocks more cheaply later. This is negative and indicates further fall.
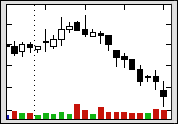
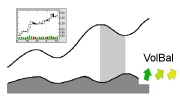
Please note the tall red volume columns in the chart on the left, combined with the low green columns. This is evident already in the first half of the chart. Volume balance was negative and gave a good warning of the falling prices to come.
Find buy opportunities with candlestick patterns
Traditionally, candlestick analysis is used to identify short-term purchase and sale signals. By identifying candle patterns, one can understand something about the change in optimism or pessimism among investors. Thus, one can also predict whether stock prices are going to go up or down for the next few days. Such signals provide good opportunities to enter in or get out of the market at favorable times.
 Read more about Candlestick patterns here.
At what time of day should trading be done?
Sometimes buyers and sellers of a stock are active at different times of day.
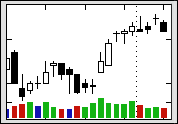
 Price rises throughout the day
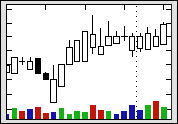
The figure shows a stock that sees few buyers in the morning, but many sellers. Such stocks open low and rise during the day. The candlestick graph shows this in a glance, as almost all the price columns are white.
- A stock with a large majority of white candlesticks should be bought in the morning and sold in the evening.
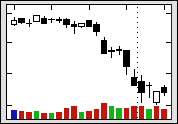
 Price falls throughout the day
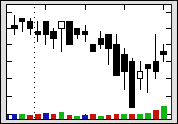
The figure shows a stock that sees few buyers in the evening, but many sellers. Such stocks fall during the day and close low. The candlestick graph shows this in a glance, as almost all the price columns are black.
- A stock with a large majority of black candlesticks should be bought in the evening and sold in the morning.
Investeringsaanbevelingen worden gedaan door Investtech.com AS ("Investtech"). Investtech garandeert geen volledigheid of juistheid van de analyses. Eventuele fouten in de aanbevelingen, koop- en verkoopsignalen en mogelijke negatieve gevolgen hiervan zijn geheel het risico van de belegger. Investtech neemt geen enkele verantwoordelijkheid voor verlies, direct of indirect, als gevolg van het gebruik van Investtechs analyses. Meer informatie omtrent Investtechs analyses kunt u vinden op disclaimer.
Investeringsaanbevelingen worden gedaan door Investtech.com AS ("Investtech"). Investtech garandeert geen volledigheid of juistheid van de analyses. Eventuele fouten in de aanbevelingen, koop- en verkoopsignalen en mogelijke negatieve gevolgen hiervan zijn geheel het risico van de belegger. Investtech neemt geen enkele verantwoordelijkheid voor verlies, direct of indirect, als gevolg van het gebruik van Investtechs analyses. Meer informatie omtrent Investtechs analyses kunt u vinden op disclaimer.
Hoofdkantoor
Strandveien 171366 Lysaker, Norway
Research-afdeling
Instituttveien 102007 Kjeller, Norway