
 Oslo Børs
 Stockholmsbörsen
 Københavns Fondsbørs
Investeringsforeninger
Københavns Fondsbørs
Investeringsforeninger
 Helsingin pörssi
 World Indices
 US Stocks
US 30
Nasdaq 100
US 500
US Stocks
US 30
Nasdaq 100
US 500
 Toronto Stock Exchange
 London Stock Exchange
 Euronext Amsterdam
 Euronext Brussel
 DAX
SDAX
TECDAX
Frankfurt
CDAX
MDAX
Prime Standard
DAX
SDAX
TECDAX
Frankfurt
CDAX
MDAX
Prime Standard
 CAC 40
 Mumbai S.E.
National S.E.
Mumbai S.E.
National S.E.
 Commodities
 Currency
 Cryptocurrency
 Exchange Traded Funds
 Investtech Indices
De trendbijbel
 Telefoon: 08-517 29 555
 Verstuur e-mail
 Word gebeld
 Bezoek ons
Investtech has studied 350,297 signals from trends in stock prices on the Nordic stock exchanges in the period 1996 to 2015. All sufficiently traded listed stocks are included and the data set is considered representative for average stock exchange development. The data set is the biggest Investtech has ever worked on, and the results are considered clearly significant.
The Trend Bible Data and Signals
Historical prices are used for the companies listed on the Oslo Stock Exchange from 1 January 1996, for the Stockholm Stock Exchange from 1 April 2003, for the Copenhagen Stock Exchange from 25 April 2005 and from the Helsinki Stock Exchange from 22 October 2007. For all markets we studied data up to and including 31 December 2015 and signals until 30 September 2015.
The time period for signals ended three months before the data, in order to have complete data to study price development for three months following the signals. The charts and analyses in one section, however, cover 250 days forward in time. For signals where we did not have prices that far ahead, missing prices are estimated to be the same as previous price. This has small overall impact, is only an issue in this particular section, and is thought to have no significance for the conclusions.
The data set consists of the same analyses as are provided to Investtechs subscribers on www.investtech.com, with an additional four years for Norway (1996-1999), where historical data were generated with the same algorithms. Looking at signals until 3 months before the end of the data period, allowed us to generate complete results for a perspective of 3 months after signal.
Only signals from companies with an average daily turnover of at least NOK 0.5m in the last 22 trading days are included.
Stock prices are adjusted for splits, subscription rights, mergers, dividend payments and other corporate actions, to ensure that the price development mirrors the actual value of the companies. All companies that have been listed on the exchange in the time period studied are included, also companies than are no longer listed today.
Benchmark for the analysis of companies listed on the Oslo Stock Exchange is the OSEBX. For the Swedish Stock Exchange, benchmark is the OMX Stockholm Benchmark GI, OMXSBGI. Benchmark for Copenhagen is the OMX C20 Cap, OMXC20CAP. Helsinki is a special case. In the charts, the OMX Helsinki, HEX, is used. However, Nokia weighed heavily in this one, and with Nokias very steep fall, it is no longer representative. In order to find relative figures for Helsinki, we have estimated a new benchmark index which is the average of the Scandinavian indices and the HEX. The Finnish data only comprise five per cent of the total number of signals, so they mean little for the combined results.
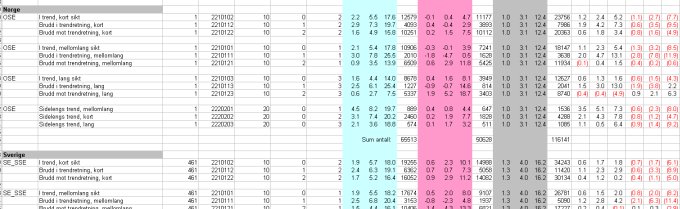
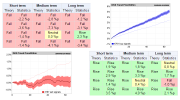
Figure 1. Screenshot from spreadsheet used to organise the research results.
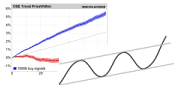
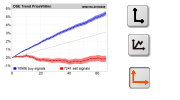
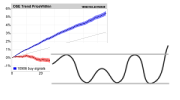
We have studied stocks in rising and falling trends, and with breaks out of horizontal trends, according to Investtechs charts. Stocks in rising trend, with breaks upwards through the ceiling of a rising trend, with breaks downwards through the floor of a rising trend and with breaks upwards from horizontal trends were assigned buy signals. Similarly stocks in falling trend, with breaks downwards though the floor of a falling trend, with breaks upwards through the ceiling of a falling trend and with breaks downwards from a horizontal trend were assigned sell signals. These definitions correspond well with established technical analysis theory.
For stocks in rising or falling trends for a long time, 22 trading days were required before the stock would trigger a new signal of the same kind.
A rising trend is defined by a rate of increase of more than 10 degrees in Investtechs charts, and a falling trend by a rate of increase of less than -10 degrees. This will come to a different annual rate of increase for different stocks, depending on volatility and the variation of the charts.
We studied signals based on Investtechs three time perspectives; short, medium long and long term. Short term is approx. a 6 month chart, medium long term is an 18 month chart and long term is a 6 year chart. Investtechs trend algorithms ran on all the charts and only the very best trend was used. This is the trend that was drawn in the charts in Investtechs subscription services and that are used in the daily updated automated analyses and comments.
The complete data set consisted of 350,297 signals from trend, distributed as shown below.
| Antall | Buy signals | Sell signals | Total | Ratio |
| Norway | 65,513 | 50,628 | 116,141 | 33 % |
| Sweden | 104,135 | 66,906 | 171,041 | 49 % |
| Denmark | 27,172 | 17,470 | 44,642 | 13 % |
| Finland | 10,990 | 7,483 | 18,473 | 5 % |
The samples of the data set are not statistically independent. This is because a stock in a rising trend can trigger several signals, i.e. one signal for every 22nd day the stock remains in the trend. An analysis of price development 66 days forward in time means that such signals will partially overlap. It is also due to the covariance between individual stocks. If the stock exchange or an individual stock rises, it is also more likely that other stocks will rise, which means the price development is not statistically independent.
However, the data set is considered more than big enough to ensure statistically significant results from an analysis.
Our main scenario is stocks in rising and falling trends in the medium long term. The Trend Bible also studies what breaks upwards and downwards from the trends signify, and whether there are differences in the short, medium long and long term.
We also look at consistency across the Nordic countries and investigate the significance of liquidity, i.e. the size of the company.
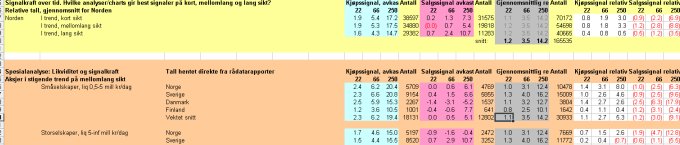
Figure 2. Screenshot from spreadsheet used to organise the research results.
Investtechs forskningsarbete baseras på studier av mer än 350.000 signaler från trender
i börsnoterade nordiska aktier från 1996 till 2015.
Praktisk användning - Verktyg - Statistik - Algoritmer - Teori
Trendbibeln - startsida Mer om Investtechs forskning

Trendbibeln är skriven av forskningschef Geir Linløkken under 2016. Forskningsteamet bakom Trendbibeln består av seniorforskarna Asbjørn Taugbøl och Fredrik Tyvand, samt Linløkken själv.
Investtech har arbetat med forskning inom behavioural finance, teknisk och kvantitativ aktieanalys sedan 1997. Företaget har utvecklat ett analyssystem som bland annat identifierar trender, stöd och motstånd, formationer och volymmönster i aktiekurser, och ger köp- och sälj-rekommendationer baserat på detta. Investtech gör omfattande användning av avancerade matematiska algoritmer och tunga statistiska metoder i sina dataprogram och internetbaserade abonnemangstjänster.
Investeringsaanbevelingen worden gedaan door Investtech.com AS ("Investtech"). Investtech garandeert geen volledigheid of juistheid van de analyses. Eventuele fouten in de aanbevelingen, koop- en verkoopsignalen en mogelijke negatieve gevolgen hiervan zijn geheel het risico van de belegger. Investtech neemt geen enkele verantwoordelijkheid voor verlies, direct of indirect, als gevolg van het gebruik van Investtechs analyses. Meer informatie omtrent Investtechs analyses kunt u vinden op disclaimer.
Investeringsaanbevelingen worden gedaan door Investtech.com AS ("Investtech"). Investtech garandeert geen volledigheid of juistheid van de analyses. Eventuele fouten in de aanbevelingen, koop- en verkoopsignalen en mogelijke negatieve gevolgen hiervan zijn geheel het risico van de belegger. Investtech neemt geen enkele verantwoordelijkheid voor verlies, direct of indirect, als gevolg van het gebruik van Investtechs analyses. Meer informatie omtrent Investtechs analyses kunt u vinden op disclaimer.
Hoofdkantoor
Strandveien 171366 Lysaker, Norway
Research-afdeling
Instituttveien 102007 Kjeller, Norway