
 Oslo Børs
 Stockholmsbörsen
 Københavns Fondsbørs
Investeringsforeninger
Københavns Fondsbørs
Investeringsforeninger
 Helsingin pörssi
 World Indices
 US Stocks
US 30
Nasdaq 100
US 500
US Stocks
US 30
Nasdaq 100
US 500
 Toronto Stock Exchange
 London Stock Exchange
 Euronext Amsterdam
 Euronext Brussel
 DAX
SDAX
TECDAX
Frankfurt
CDAX
MDAX
Prime Standard
DAX
SDAX
TECDAX
Frankfurt
CDAX
MDAX
Prime Standard
 CAC 40
 Mumbai S.E.
National S.E.
Mumbai S.E.
National S.E.
 Commodities
 Currency
 Cryptocurrency
 Exchange Traded Funds
 Investtech Indices
Three buy candidates for medium to long term
Published March 06, 2019
Nifty 50 (NIFTY) developed positively Tuesday, and gained 1.14 per cent to a close of 10987 points. The broader index has marked its territory by moving in a sideways trend for over three months now with a low of 10488 points and high of 11069 points in the medium term. It is not very difficult to understand that the markets are waiting for its next trigger to decide on a clear direction, and that trigger could possibly be the Lok Sabha elections this year.
We write about three stocks that have bottomed out or are in the process.
Triveni Engineering & (TRIVENI.NS) Close: 58.45
Triveni Engineering & Industries Limited is inside a rising trend channel in all time frames; short, medium and long term. After a long period of consolidation, the stock has broken through a resistance of 56 rupees and 52 rupees on the longer term chart.
The rise in stock price has been supported by rising momentum and optimistic buyers, as indicated by the green arrows of the volume balance indicator. The short term momentum of the stock is strongly positive, with RSI above 70. This indicates increasing optimism among investors and further price increase for Triveni Engineering & Industries Limited.
There is no clear resistance in the medium term chart, so the stock may rise to its earlier top of 107 rupees in coming months or quarters. On the downside there is support between 46 and 42 rupees.
The stock is very volatile and price variation can be high on a day to day basis.
Recommendation one to six months: Positive
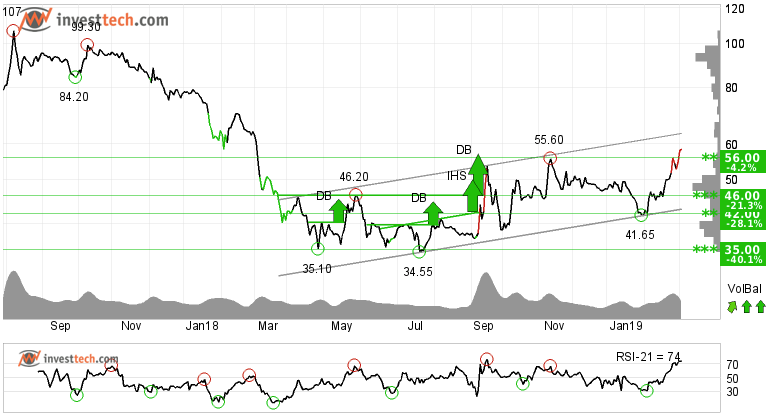
NMDC Limited (NMDC.NS) Close: 105.75

NMDC Limited has broken through the ceiling of a falling trend channel in the medium term. This may be the start of a more horizontal development. Higher tops and higher bottoms will indicate of a new rising trend.
The price has risen strongly since the positive signal from an inverse head and shoulders formation at the break through resistance at 96.44. The objective at 104 is now met, but the formation signals further rise in the same direction. The stock has support at rupee 95.00 and resistance at rupee 116. Volume tops and volume bottoms correspond well with tops and bottoms in the price. This strengthens the stock. RSI is above 70 after a good price increase in the past weeks. The stock has strong positive momentum and further increase is indicated.
In the longer term the stock has established a bottom at 90 rupees which can be seen as a longer term support. Resistance is at 116 and 124 respectively. The stock is weak positive because no uptrend channel is established yet.
Recommendation one to six months: Weak Positive
NCC Limited (NCC.NS) Close: 98.15
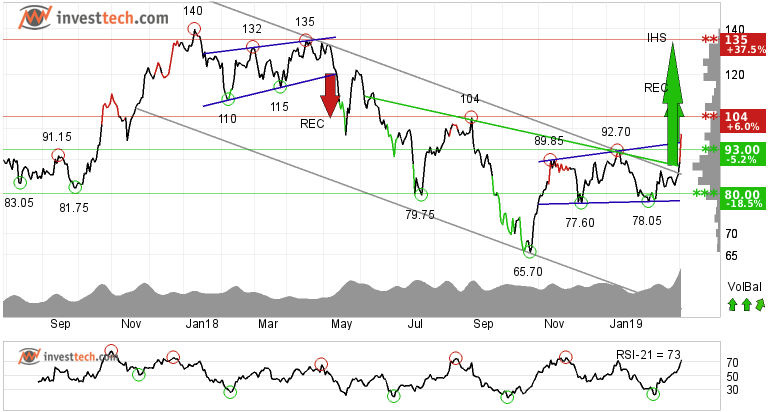
NCC Limited has broken up from the falling trend channel and rectangle and inverted head and shoulders formations. Further rise to 134 rupees or more is suggested. There is resistance around 104 and 135 rupees and support between 93 and 90 rupees in the short term.
The volume balance is positive and strengthens the stock in the short term. RSI is above 70 after a good price increase the past weeks. The stock has strong positive momentum and further increase is indicated. The stock is overall assessed as technically positive for the short term.
The stock is volatile and has a monthly variation of 21 percent.
Recommendation one to six months: Positive
The analyses are based on closing price as per March 5, 2019. Maintaining proper stop loss is always recommended.
Geschreven door

Analist
in Investtech
Archive:
28 February: Breakout in these three stocks invites for early opportunity
26 February: Two buy opportunities for the near term future
21 February: Stocks with RSI above 70, based on our research
19 February: Close to selling point, time to be cautious
15 February: These two sugar stocks look promising
14 February: Three short to medium term opportunities
08 February: One buy and one sell in stocks while index suggests caution
06 February: One buy and one sell, short to medium term opportunities
01 February: Upside breakout from price formations
30 January: Buying opportunity: Reversing from trend channel support
9 January: One positive and one to stay away from
2 January: A good investment opportunity
2018
21 December: Good buying opportunities
14 December: Positive on these three stocks
11 December: One buy and one sell signal
07 December: Sell Signals in Three Big Stocks
04 December: Highest scorer of our Top 50 list
30 November: Positive stocks with 5-11 per cent upside potential
28 November: Buy signal on high volume
27 November: One Buy and One Sell Signal
23 November: Fear dominates these stocks
21 November: Sell signal, time to stay away
20 November: Early opportunity from short term buy signal?
16 November: Two Buy Signals and One Sell Signal
15 November: Buy signal in this one
13 November: Big auto stocks comparison
09 November: What to wait for?
06 November: Banking stocks look positive
02 November: Positive on this one
01 November: TECHM, NIFTY50 and Hausse
31 October: What are investors thinking?
30 October: Bullish on these three stocks
26 October: Three potential candidates to ride on
24 October: Three big Metal stocks, Seasonal variation
22 October: Among top performers on our Top 50 list
18 October: Three stocks investors should stay away from
17 October: Flowing against the tide
16 October: Positive on these 2 stocks
11 October: Over 45 per cent rise
9 October: The Indian banking space
5 October: Nifty closes at a crucial level
2 October: Price formations in the long-term charts
28 September: Positive on Biocon Limited
"Investtech analyseert de psychologie in de markt en geeft u iedere dag concrete trading-voorstellen."

Partner & Senior Advisor - Investtech


Investeringsaanbevelingen worden gedaan door Investtech.com AS ("Investtech"). Investtech garandeert geen volledigheid of juistheid van de analyses. Eventuele fouten in de aanbevelingen, koop- en verkoopsignalen en mogelijke negatieve gevolgen hiervan zijn geheel het risico van de belegger. Investtech neemt geen enkele verantwoordelijkheid voor verlies, direct of indirect, als gevolg van het gebruik van Investtechs analyses. Meer informatie omtrent Investtechs analyses kunt u vinden op disclaimer.
Investeringsaanbevelingen worden gedaan door Investtech.com AS ("Investtech"). Investtech garandeert geen volledigheid of juistheid van de analyses. Eventuele fouten in de aanbevelingen, koop- en verkoopsignalen en mogelijke negatieve gevolgen hiervan zijn geheel het risico van de belegger. Investtech neemt geen enkele verantwoordelijkheid voor verlies, direct of indirect, als gevolg van het gebruik van Investtechs analyses. Meer informatie omtrent Investtechs analyses kunt u vinden op disclaimer.
Hoofdkantoor
Strandveien 171366 Lysaker, Norway
Research-afdeling
Instituttveien 102007 Kjeller, Norway