Three buy opportunities, price-volume breakout
Published April 11, 2019
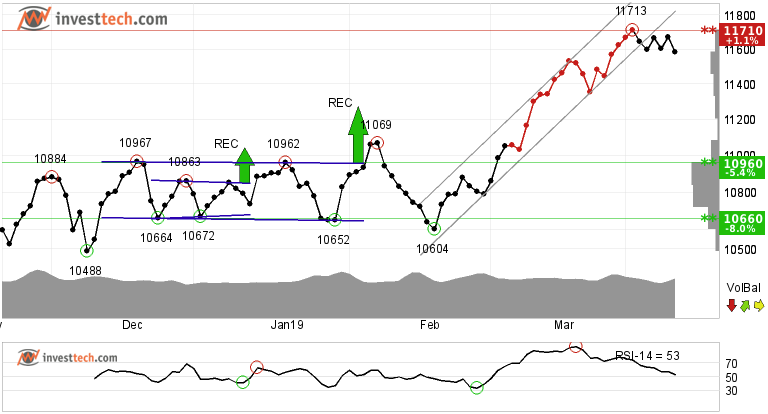
The market showed a small loss on Wednesday and Nifty 50 (NIFTY) ended the day at 11584 points, which is a decline of 0.75 per cent. For the past few trading sessions, the broader index has been playing around its previous highest close of 11739 points and trying to breach that mark. However, the short term momentum indicator RSI-14 just got shy and started to diverge at the point when Nifty 50 was in its full power attempting to close above 11700. It suggests that market momentum was little short of giving that extra push that could have taken the index to a new high.
May be it is waiting for the election results to give us all an unexpected surprise. That we have to wait to see. But there are three stocks that we have identified today which have given a breakout from bottom price formations and could turn out to be good potential investments.
Siemens Limited (SIEMENS.NS) Close: 1165.65
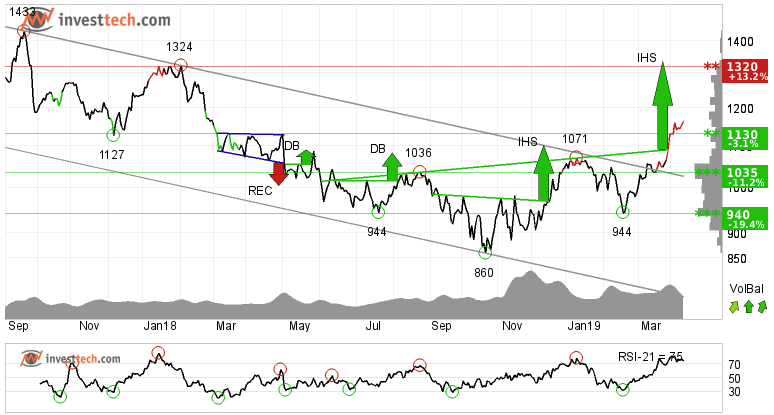
Siemens has broken out of the falling trend channel in the medium term chart. It has given a price breakout from the inverted head and shoulders formation both in the medium and long term charts and is now above its resistance of 1130 rupees. Further rise to 1336 or more is signalled.
Momentum is strong in the stock as indicated by the RSI curve. Over the past few month,s buyers have been pushing the price higher while sellers have been passive in selling the stock at lower levels. This has resulted in positive volume balance.
The stock has support at the 1130 and 1050 levels. While resistance is around the 1320-1340 and 1430 area. The stock is overall assessed as technically positive in the short to medium term.
Recommendation one to six months: Positive
Indiabulls Real Estate (IBREALEST.NS) Close: 119.05
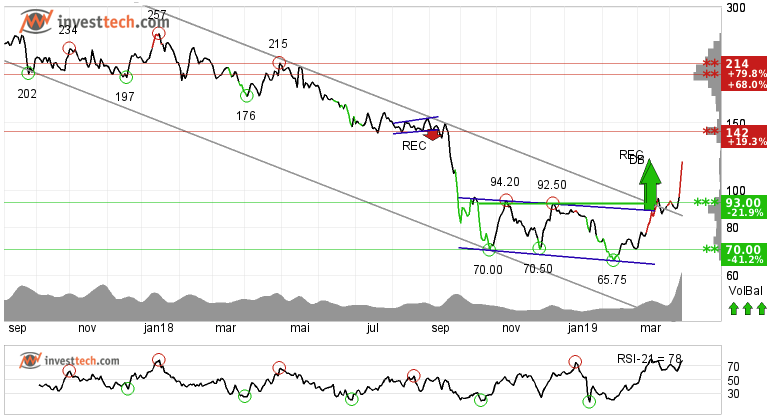
Indiabulls Real Estate Limited has given a price-volume breakout by breaking through the ceiling of a falling trend channel in the medium and long term charts. After a period of condensation, the stock has given buy signal from a rectangle formation by a break up through a long standing resistance. Further rise to 121 or more is signalled. The stock has support at rupee 93.00 and resistance at rupees 142 and 200.
Positive volume balance indicates that buyers are aggressive while sellers are passive, and strengthens the stock. RSI is above 70 after a good price increase the past weeks. The stock has strong positive momentum and further increase is indicated.
Given the sharp rise in price which may or may not be followed by a period of retracement or consolidation, one must be cautious and also of high volatility in the stock . Hence identifying your entry and maintaining tight stoploss are always recommended.
Recommendation one to six months: Positive
Tata Motors Limited (TATAMOTORS.NS) Close: 216.05
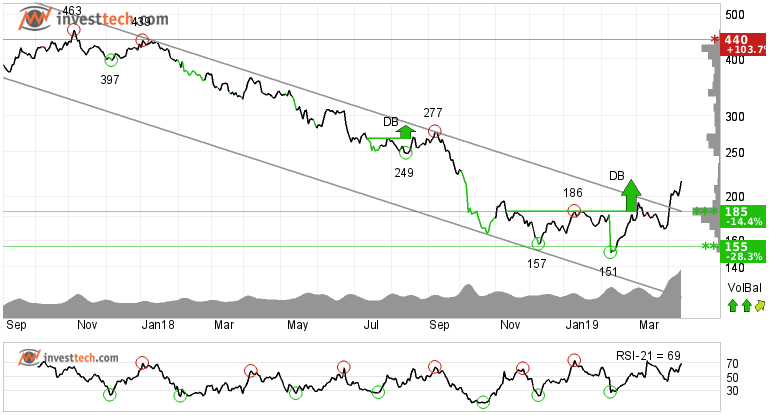
Tata Motors limited has a similar story as Indiabulls Real Estate Limited. The stock retraced back after giving a breakout from a double bottom formation and early this month broke above the resistance of 185 rupees on high volume. Currently there is no established trend in the stock, but the price-volume breakout suggests further rise in price in the short term.
Positive volume balance and rising momentum strengthen the breakout and support the price rise. There is now support around 185 rupees and first resistance could be around 275 rupees, as suggested by the long term chart. The stock is overall assessed as technically positive in short to medium term.
Recommendation one to six months: Positive
The analyses are based on closing price as per April 10, 2019. Maintaining proper stop loss is always recommended.
Skrivet av

Analytiker
i Investtech
Archive:
29 March: Two stocks to stay from
27 March: Recent breakouts in three stocks, short term opportunity
21 March: Three buy and one sell
12 March: Cement stocks are posing good opportunity
08 March: Clear breakout and reversal from intermediate downtrend
07 March: Deepak Nitrite Limited looks promising to enter into a trade
06 March: Three buy candidates for medium to long term
28 February: Breakout in these three stocks invites for early opportunity
26 February: Two buy opportunities for the near term future
21 February: Stocks with RSI above 70, based on our research
19 February: Close to selling point, time to be cautious
15 February: These two sugar stocks look promising
14 February: Three short to medium term opportunities
08 February: One buy and one sell in stocks while index suggests caution
06 February: One buy and one sell, short to medium term opportunities
01 February: Upside breakout from price formations
30 January: Buying opportunity: Reversing from trend channel support
9 January: One positive and one to stay away from
2 January: A good investment opportunity
2018
21 December: Good buying opportunities
14 December: Positive on these three stocks
11 December: One buy and one sell signal
07 December: Sell Signals in Three Big Stocks
04 December: Highest scorer of our Top 50 list
30 November: Positive stocks with 5-11 per cent upside potential
28 November: Buy signal on high volume
27 November: One Buy and One Sell Signal
23 November: Fear dominates these stocks
21 November: Sell signal, time to stay away
20 November: Early opportunity from short term buy signal?
16 November: Two Buy Signals and One Sell Signal
15 November: Buy signal in this one
13 November: Big auto stocks comparison
09 November: What to wait for?
06 November: Banking stocks look positive
02 November: Positive on this one
01 November: TECHM, NIFTY50 and Hausse
31 October: What are investors thinking?
30 October: Bullish on these three stocks
26 October: Three potential candidates to ride on
24 October: Three big Metal stocks, Seasonal variation
22 October: Among top performers on our Top 50 list
18 October: Three stocks investors should stay away from
17 October: Flowing against the tide
16 October: Positive on these 2 stocks
11 October: Over 45 per cent rise
9 October: The Indian banking space
5 October: Nifty closes at a crucial level
2 October: Price formations in the long-term charts
28 September: Positive on Biocon Limited
"Investtech analyserar psykologin i marknaden och ger dig konkreta tradingförslag varje dag."

Partner & Senior Advisor - Investtech
Investtech garanterar inte fullständigheten eller korrektheten av analyserna. Eventuell exponering utifrån de råd / signaler som framkommer i analyserna görs helt och fullt på den enskilda investerarens räkning och risk. Investtech är inte ansvarig för någon form för förlust, varken direkt eller indirekt, som uppstår som en följd av att ha använt Investtechs analyser. Upplysningar om eventuella intressekonflikter kommer alltid att framgå av investeringsrekommendationen. Ytterligare information om Investtechs analyser finns på infosidan.
Investtech garanterar inte fullständigheten eller korrektheten av analyserna. Eventuell exponering utifrån de råd / signaler som framkommer i analyserna görs helt och fullt på den enskilda investerarens räkning och risk. Investtech är inte ansvarig för någon form för förlust, varken direkt eller indirekt, som uppstår som en följd av att ha använt Investtechs analyser. Upplysningar om eventuella intressekonflikter kommer alltid att framgå av investeringsrekommendationen. Ytterligare information om Investtechs analyser finns på infosidan.


 Oslo Børs
 Stockholmsbörsen
 Københavns Fondsbørs
 Helsingin pörssi
 World Indices
 US Stocks
 Toronto Stock Exchange
 London Stock Exchange
 Euronext Amsterdam
 Euronext Brussel
 DAX
DAX CAC 40
 Mumbai S.E.
 Commodities
 Currency
 Cryptocurrency
 Exchange Traded Funds
 Investtech Indices


