
 Oslo Børs
 Stockholmsbörsen
 Københavns Fondsbørs
Investeringsforeninger
Københavns Fondsbørs
Investeringsforeninger
 Helsingin pörssi
 World Indices
 US Stocks
US 30
Nasdaq 100
US 500
US Stocks
US 30
Nasdaq 100
US 500
 Toronto Stock Exchange
 London Stock Exchange
 Euronext Amsterdam
 Euronext Brussel
 DAX
SDAX
TECDAX
Frankfurt
CDAX
MDAX
Prime Standard
DAX
SDAX
TECDAX
Frankfurt
CDAX
MDAX
Prime Standard
 CAC 40
 Mumbai S.E.
National S.E.
Mumbai S.E.
National S.E.
 Commodities
 Currency
 Cryptocurrency
 Exchange Traded Funds
 Investtech Indices
Stocks with RSI above 70, based on our research
Published February 21, 2019
RSI or the Relative Strength Index is a familiar term and the most popular indicator used so far in the field of technical analysis. This is a momentum indicator that shows how a stock has performed relative to its own price over a certain period. The indicator value moves between 0 and 100.
Theory suggests: that a stock is overbought when RSI is over 70 and oversold when the RSI value is below 30. Hence one must sell the stock if RSI crosses over 70 as it shows that the buyers are overwhelming the stock price and a correction is inevitable. Just the opposite thought is suggested when RSI is below 30. But is this really true in the real trading scenario? Should one sell the stock if its RSI is above 70 and buy if RSI is below 30?
Research suggests: To answer this question we did an algorithm based research. The report is based on 12 years of data from the National Stock Exchange in India which shows that stocks with high RSI, above the critical 70 level, have continued to rise. Similarly stocks with low RSI, below the critical 30 level, have continued to underperform vs benchmark.
We have studied 31,220 cases where RSI21 crossed above the 70 limit and 23,404 cases where RSI21 fell below the 30 limit. We called this strategy RSI momentum and called it a buy signal when RSI went above 70 and a sell signal when RSI fell below 30, quite the opposite of what the theory suggests.

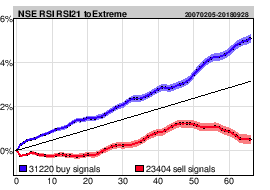
The chart shows price development the first 66 days after RSI momentum signals compared to benchmark development in the period. Blue line is buy signals, red line is sell signals and black is benchmark index.
The table below shows annualized excess return following RSI momentum signals. The figures are based on the quarterly figures, i.e. excess return 66 days (3 months) after the signal was triggered.
| Annualized excess return | |
| Buy signal RSI21 breaks above 70 | 9.0 %p |
| Sell signal RSI21 breaks below 30 | -10.9 %p |
%p: percentage points
The results indicate that RSI is a well-suited momentum indicator and that investments based on buy signals from RSI momentum give statistically stronger return than average benchmark.
Investtech offers a number of stock picking tools, and using Stock selection you can set criteria for RSI, allowing you to find for instance all stocks with RSI above 70. You can also set criteria for liquidity and volatility.
Complete report available here.
On our stock selection criteria, NSE stocks only, we set liquidity parameter to be 50 million rupees or above and RSI above 70. Interestingly, only 6 stocks came up on the list in the medium term, presumably because the market has been more in a sideways trend lately and many stocks have fallen after making temporary highs. Here we publish analyses for only three stocks, but you can experiment with the Stock selection tool and find out what stocks you get and if they offer good trading opportunities.
Wipro Limited (WIPRO.NS) Close: 372.20
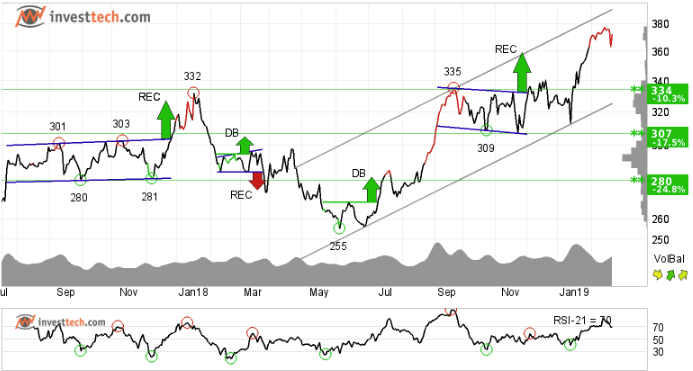
Since our last recommendation of Wipro on September 25th, the stock has gained almost 12 per cent and still shows strong development within a rising trend channel in the medium term. Rising trends indicate that the company experiences positive development and that buy interest among investors is increasing.
RSI above 70 shows that the stock has strong positive momentum in the short term. Investors have steadily paid more to buy the stock, which indicates increasing optimism and that the price will continue to rise.
There is no visible resistance for the stock price in the medium and long term charts. However, the stock is around a level which was last established in 2009, so one must be cautious and a strict stop loss is always suggested. In the medium term, which is one to six months, there is support around 334-340 rupees. The stock is overall assessed as technically positive for the medium term.
Recommendation one to six months: Positive
HCL Technologies Limit (HCLTECH.NS) Close: 1057.95
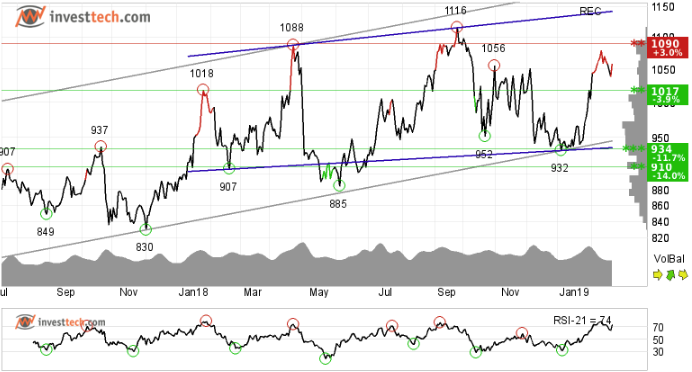
HCL Technologies Limited is in a rising trend channel both in the medium and long term. This shows that investors over time have bought the stock at higher prices and indicates good development for the company. The stock is moving within a rectangle formation between support at 936 and resistance at 1143. A decisive break through one of these levels indicates the new direction for the stock. The stock has support at rupee 1017 and resistance at rupee 1090.
RSI is above 70 after a good price increase the past weeks. The stock has strong positive momentum and further increase is indicated. The RSI curve shows a rising trend and the volume balance indicator is also positive. Combined these indicators support the positive trend. The stock is overall assessed as technically positive for the medium term.
Recommendation one to six months: Positive
MphasiS Limited (MPHASIS.NS) Close: 1041.25
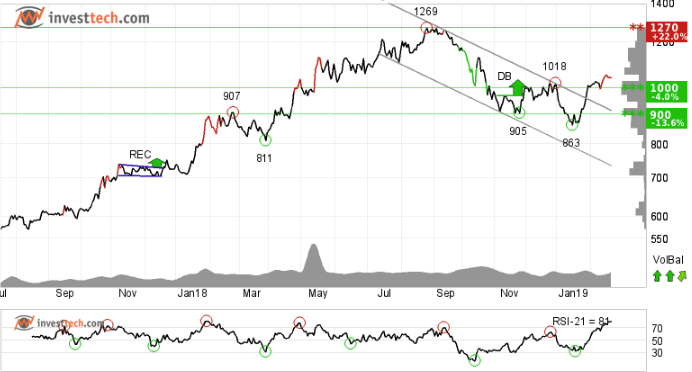
We published an analysis of MPHASIS on 08.02.2019. The bigger picture has not changed much, apart from the fact that price has gone up from 1022.95 to 1041.25.
Recommendation one to six months: Positive
The analyses are based on closing price as per February 20, 2019. Maintaining proper stop loss is always recommended.
Skrivet av

Analytiker
i Investtech
Archive:
19 February: Close to selling point, time to be cautious
15 February: These two sugar stocks look promising
14 February: Three short to medium term opportunities
08 February: One buy and one sell in stocks while index suggests caution
06 February: One buy and one sell, short to medium term opportunities
01 February: Upside breakout from price formations
30 January: Buying opportunity: Reversing from trend channel support
9 January: One positive and one to stay away from
2 January: A good investment opportunity
2018
21 December: Good buying opportunities
14 December: Positive on these three stocks
11 December: One buy and one sell signal
07 December: Sell Signals in Three Big Stocks
04 December: Highest scorer of our Top 50 list
30 November: Positive stocks with 5-11 per cent upside potential
28 November: Buy signal on high volume
27 November: One Buy and One Sell Signal
23 November: Fear dominates these stocks
21 November: Sell signal, time to stay away
20 November: Early opportunity from short term buy signal?
16 November: Two Buy Signals and One Sell Signal
15 November: Buy signal in this one
13 November: Big auto stocks comparison
09 November: What to wait for?
06 November: Banking stocks look positive
02 November: Positive on this one
01 November: TECHM, NIFTY50 and Hausse
31 October: What are investors thinking?
30 October: Bullish on these three stocks
26 October: Three potential candidates to ride on
24 October: Three big Metal stocks, Seasonal variation
22 October: Among top performers on our Top 50 list
18 October: Three stocks investors should stay away from
17 October: Flowing against the tide
16 October: Positive on these 2 stocks
11 October: Over 45 per cent rise
9 October: The Indian banking space
5 October: Nifty closes at a crucial level
2 October: Price formations in the long-term charts
28 September: Positive on Biocon Limited
"Investtech analyserar psykologin i marknaden och ger dig konkreta tradingförslag varje dag."

Partner & Senior Advisor - Investtech


Investtech garanterar inte fullständigheten eller korrektheten av analyserna. Eventuell exponering utifrån de råd / signaler som framkommer i analyserna görs helt och fullt på den enskilda investerarens räkning och risk. Investtech är inte ansvarig för någon form för förlust, varken direkt eller indirekt, som uppstår som en följd av att ha använt Investtechs analyser. Upplysningar om eventuella intressekonflikter kommer alltid att framgå av investeringsrekommendationen. Ytterligare information om Investtechs analyser finns på infosidan.
Investtech garanterar inte fullständigheten eller korrektheten av analyserna. Eventuell exponering utifrån de råd / signaler som framkommer i analyserna görs helt och fullt på den enskilda investerarens räkning och risk. Investtech är inte ansvarig för någon form för förlust, varken direkt eller indirekt, som uppstår som en följd av att ha använt Investtechs analyser. Upplysningar om eventuella intressekonflikter kommer alltid att framgå av investeringsrekommendationen. Ytterligare information om Investtechs analyser finns på infosidan.
Copyright Ⓒ 1997-2024 Investtech.com AS, Org nr 978 655 424 MVA Integrationspolicy | Ansvarsfrånskrivelse
Huvudkontor
Strandveien 171366 Lysaker, Norway
Analysavdelning
Instituttveien 102007 Kjeller, Norway