Global stocks: Market sentiment: What are investors thinking?
Published October 31, 2018
Today we are taking a quick view at the broader US market indices US500 (S&P500), NASDAQ-100 index (NASDAQ Composite Index) and the Hausse index.
US500 Index (US500.US500) Close: 2682.63
US500 Index (US500) developed positively on Tuesday, and gained 1.57 per cent to a close at 2683 points.
437 shares gained and 55 shares showed losses. None of the shares were unchanged and closed at the same price as the previous day. There was no trading in 10 shares.
Total value of the trading volume for shares and primary capital certificates on Tuesday was approximately 238.8 billion
Technical analysis (medium term):
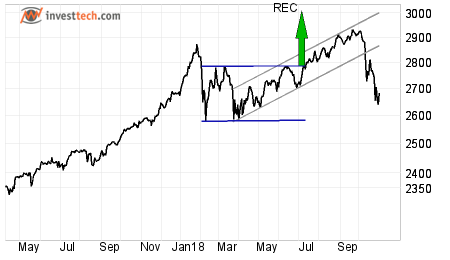
US500 index has broken down through the rising trend channel. Earlier in July this year, the index gave a buy signal from a clear rectangle formation. And one cannot complain as it almost, yes almost, reached its target of 2992. It started to reverse after establishing its highest close ever at 2931.
The index has now broken its crucial support of 2700, but is still holding over 2580 in the medium term. This gives us some hope for the time being. But a sell signal will be initiated if the US500 closes below 2580.
On the other hand, for the optimistic investors and traders, one must wait for the short term downtrend to reverse, and that seems to be possible if the index manages to close above 2820 and eventually 2870 points, which we suppose is not going to happen overnight. So we must sit and watch while our patience is being tested.
The index is assessed as technically slightly negative for the medium term.
Investtech's outlook (one to six months): Weak Negative
Nasdaq-100 Index (NDX.NAS100) Close: 6810.12
Nasdaq-100 Index (NDX) developed positively Tuesday, and gained 1.43 per cent to a close of 6810 points.
87 shares showed a gain and 16 showed a loss. 0 shares were unchanged and closed at the same price as the previous day. There was no trading in 1 share.
The value of the total volume of shares and primary capital certificates traded Tuesday was approximately 99.6 billion.
Technical analysis (medium term):
Looking at the Nasdaq-100 index, it does not project a very unique picture from the US500 index.
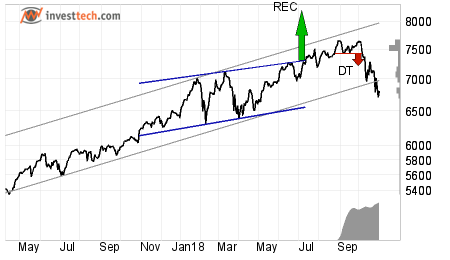
It gave an early sell signal from a very small double top formation, which certainly turned out to be fruitful for many. Then it broke the support around 7150 points, and eventually the uptrend channel on the negative side.
The index has support around 6400 and resistance at 7150 points. A break from one of these levels on either side may trigger either fresh selling or a change of trend on the upside.
Investtech's outlook (one to six months): HOLD
Hausse index
The Hausse Index is an indicator for market optimism, or more generally a sentiment indicator. It shows the ratio of investors who are positive in the market. Analysis of the hausse index can be an important part of an overall market analysis. Hausse analysis can show the level of optimism among short term and long term investors, and whether the optimism is rising or falling. In special situations, following long rises or falls, hausse analysis can identify the turning points in the market.
The Hausse index shows the ratio between number of companies that have triggered buy signals and total number of companies. The index has a value between 0 and 100, where 0 means that every company’s last signal was a sell signal, and 100 means that every company’s last signal was a buy signal. Values above 50 indicate that a majority of investors are positive.
Investtech’s short term hausse index (hausse1) measures optimism among short term investors. The index is a good gauge for the level of activity in the market among investors who tend to keep a stock for one to six weeks.
Investtech’s long term hausse index (hausse2) measures optimism among long term investors. It shows mood swings in the market among long term investors who tend to keep the same stock for several months or years.
For the US500, the value of Hausse1, which indicates the short term, is at 23 points. It suggests that pessimism is persisting among short term investors, while optimism is at rest. However, the value increased by 7 points in course of one week. This may provide some relief to the short term investors.
For the longer term, Hausse2 is currently at 31 points, two points below last week's value of 33. Overall this indicates that the bigger picture is looking better for the US500 index in comparison to the short term, as suggested by the two hausse indices.
Our take away from this is that one should be cautious in the current market scenario where uncertainty is prevalent. Keep a hawk's eye on any market opportunity you get, but use your wise judgement. After all, it's your hard earned money.
The analyses are based on closing price as per October 30, 2018.
Written by

Analyst - Investtech
"Investtech analyses the psychology of the market and gives concrete trading suggestions every day."

Partner & Senior Advisor - Investtech
Investtech guarantees neither the entirety nor accuracy of the analyses. Any consequent exposure related to the advice / signals which emerge in the analyses is completely and entirely at the investors own expense and risk. Investtech is not responsible for any loss, either directly or indirectly, which arises as a result of the use of Investtechs analyses. Details of any arising conflicts of interest will always appear in the investment recommendations. Further information about Investtechs analyses can be found here disclaimer.
The content provided by Investtech.com is NOT SEC or FSA regulated and is therefore not intended for US or UK consumers.


 Oslo Børs
 Stockholmsbörsen
 Københavns Fondsbørs
 Helsingin pörssi
 World Indices
 US Stocks
 Toronto Stock Exchange
 London Stock Exchange
 Euronext Amsterdam
 Euronext Brussel
 DAX
DAX CAC 40
 Mumbai S.E.
 Commodities
 Currency
 Cryptocurrency
 Exchange Traded Funds
 Investtech Indices


