Global stocks: FANG stocks - could they fall a further 10-20 per cent?
Published November 21, 2018
Webinar November 28
Join our free online webinar on November 28, 15.00-15.45 CET . Analyst Kiran Shroff and Country Manager Jan Marius van Leeuwen will give an introduction to Investtech's analyses and present stock picking tools & strategies.
In the last two trading sessions, S&P 500 index is down by -3.45%, Nasdaq 100 index by -4.95% and CDAX by -2.66%. FTSE 100 is still holding a little ground and is down by roughly 1%, probably because it is trying to find its clues mainly from any decision on Brexit.
S&P 500 has closed just on its short term support level of 2640. If it breaks and closes below that level, it may fall further to 2580 points or lower.
Nasdaq 100 index is already trading below its earlier short term support of 6720 points and is now heading towards 6400 levels. No clear support below that on our chart.
FTSE 100 (UKX) is just above its support of 6900-6880 points.
Big stocks that have majorly underperformed the markets in the last couple of months are FANG stocks, as they are called, comprised of Facebook Inc. (FB), Netflix Inc. (NFLX), Alphabet Inc. (GOOGL) and Amazon.com Inc. (AMZN). These stocks have fallen sharply since September, in the range of -20% to -40%.
The question is what may happen to their stock prices in the coming time. What do our charts suggest? All the stocks we have analyzed here suggest a sell signal in the short term charts, and even though we have shared medium term charts, that certainly shows a bigger picture.
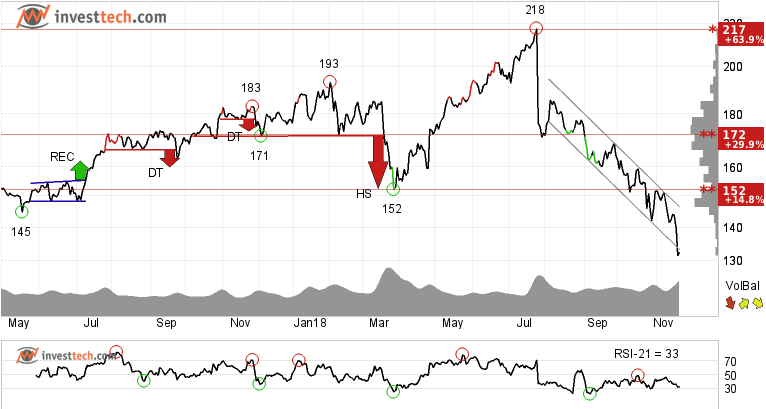
Facebook Inc (FB.US) Close: 132.43
Facebook Inc. has fallen about 39 per cent from its top in July, since it presented its second quarter earnings numbers. The stock has marginally broken down through the bottom line of the downward trend channel in the medium term, but more worrisome is the sell signal from the double top formation in the longer term chart. Further downside is indicated.
The price formation gives a target of 86 dollars, which is 35 per cent lower than yesterday's close. But there is intermediate support around 116 dollars or 12 per cent lower. The stock has resistance between 142-150 dollars.
Investtech's outlook (one to six months): Sell
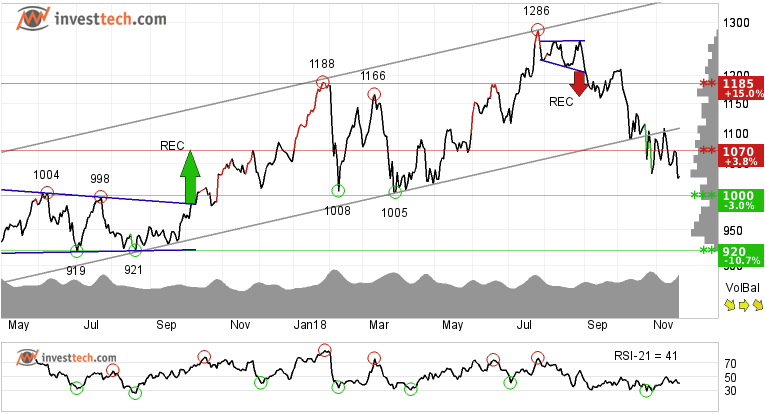
Alphabet Inc. (GOOGL.US) Close: 1030.45
Alphabet Inc broke down after giving a sell signal from a small rectangle formation, formed at the top of the price chart. It broke down through multiple support levels before finally breaking down through the uptrend channel in the medium term. Further downside is indicated.
The stock is 3 per cent away from its support at 1000 dollars, which if broken and closed below, we may see further downside to 920 levels.
Investtech's outlook (one to six months): Sell
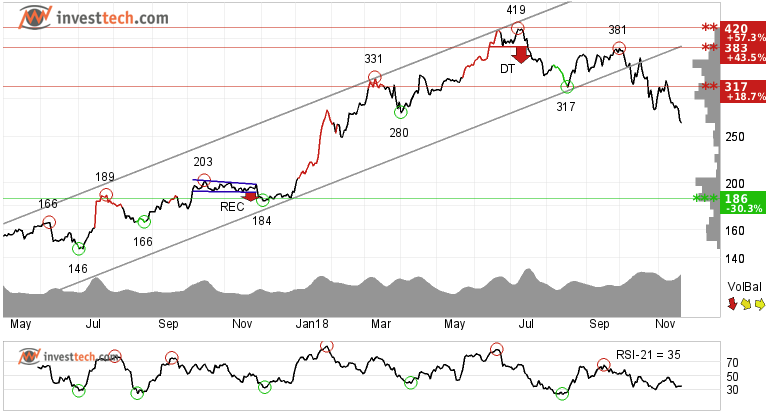
Netflix Inc (NFLX.US) Close: 266.98
Netflix Inc gave a sell signal from a small double top formation at 383 levels and the stock could not manage to break through that level again since then. The Netflix stock price has broken down from the rising trend channel and has also broken the support at 317 dollars which theoretically should work as resistance in case of any price correction.
The stock has corrected around 36 per cent from the top and its next support in the medium term chart is at 186 dollars or equivalent to 30 lower than last close.
Investtech's outlook (one to six months): Sell
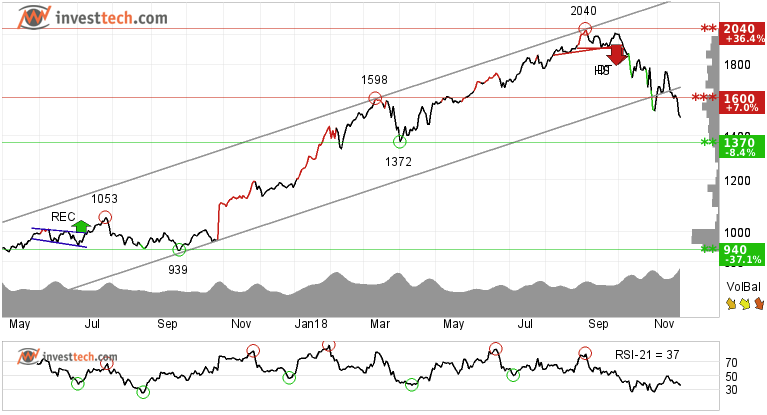
Amazon.Com Inc (AMZN.US) Close: 1495.46
The Amazon.com Inc stock price has corrected 27 per cent from its august top and the medium term chart suggests that it may fall an additional 8 per cent to its next support of 1370 dollars or further down from there.
The price broke through the bottom of the uptrend channel and also the support at 1600 dollars. Momentum in the stock is weak. Volume has also been higher on price bottoms and lower on price tops, which added fuel to the downfall. In case of any reaction on the upside, there is resistance around 1600 dollars.
Investtech's outlook (one to six months): Sell
The analyses are based on closing price as per November 20, 2018.
Note: These instruments are traded in currency based on the exchange or country they are listed on.
Written by

Analyst - Investtech
"Investtech analyses the psychology of the market and gives concrete trading suggestions every day."

Partner & Senior Advisor - Investtech
Investtech guarantees neither the entirety nor accuracy of the analyses. Any consequent exposure related to the advice / signals which emerge in the analyses is completely and entirely at the investors own expense and risk. Investtech is not responsible for any loss, either directly or indirectly, which arises as a result of the use of Investtechs analyses. Details of any arising conflicts of interest will always appear in the investment recommendations. Further information about Investtechs analyses can be found here disclaimer.
The content provided by Investtech.com is NOT SEC or FSA regulated and is therefore not intended for US or UK consumers.


 Oslo Børs
 Stockholmsbörsen
 Københavns Fondsbørs
 Helsingin pörssi
 World Indices
 US Stocks
 Toronto Stock Exchange
 London Stock Exchange
 Euronext Amsterdam
 Euronext Brussel
 DAX
DAX CAC 40
 Mumbai S.E.
 Commodities
 Currency
 Cryptocurrency
 Exchange Traded Funds
 Investtech Indices