Global stocks: Two buy and one sell - Facebook gives a buy signal
Published April 10, 2019
The market showed a small loss on Tuesday and S&P 500 (SP500) ended the day at 2878.20 points, which is a decline of 0.61 per cent. The index thereby reversed down after eight days of gains. 96 shares showed a gain and 394 showed a loss. 2 shares were unchanged and closed at the same price as the previous day.
The S&P 500 index is inside a rising trend in the medium term chart. This signals increasing optimism among investors and indicates continued rise. The broader index is only 1.8 per cent short of its all time high close that was established in September last year, while there is support around 2800 points for the index.
Today we cover three US stocks of which two are positive and one is negative.
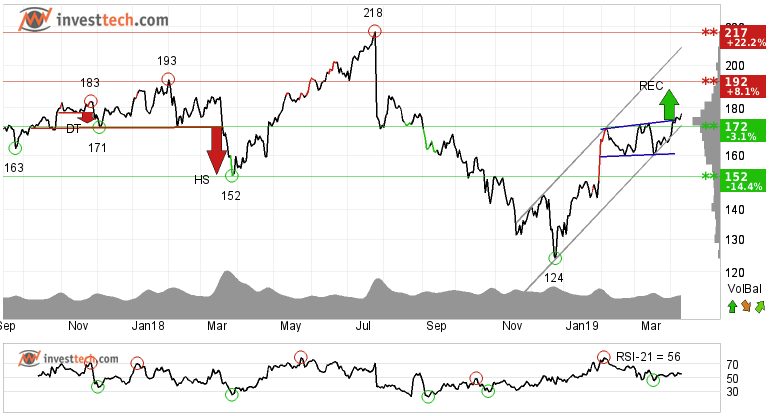
Facebook Inc (FB.US500) Close: 177.58
Investors have paid higher prices over time to buy Facebook Inc and the stock is in a rising trend channel in the medium term. This signals increasing optimism among investors.
After falling by almost 43 per cent in later half of 2018 and thereafter recovering by a good margin this year, the stock recently gave a buy signal as it broke above from a rectangle formation and a resistance level at 172 dollars both in the medium and short term. Further rise to 188 or more is signalled. The next resistance levels are at 192 and 217 dollars. There is now support between 172 and 160 dollars.
The short term momentum indicator RSI is above 70 and volume balance is positive, suggesting that more people are buying with rising price. These indicators strengthen the underlying trend in the short term. The stock is overall assessed as technically positive for the short to medium term.
Investtech's outlook (one to six months): Buy
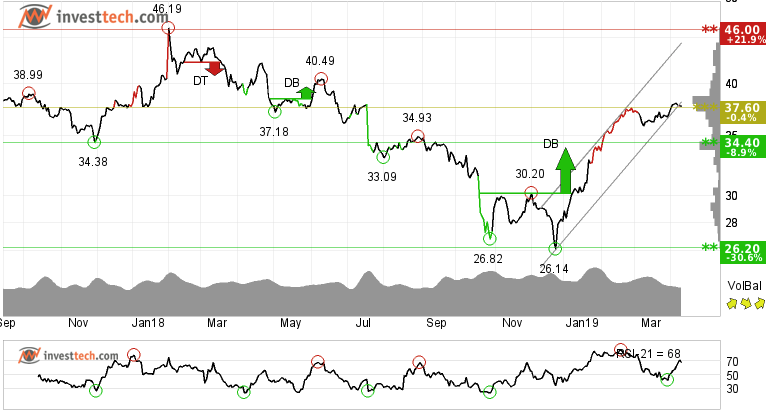
eBay Inc. (EBAY.US500) Close: 37.75
The e-commerce giant eBay Inc. has marginally broken the bottom of the rising trend channel and is taking support at 37.60 dollars in the medium term chart.
Since the beginning of new year, the stock has gone up by more than 40 per cent and is still looking strong. It is inside the rising trend channel in the long term price graph and the strong momentum, as indicated by RSI, does not seem to give way very easily.
Even though the volume balance indicator is more or less neutral, the price behaviour itself signals underlying strength in the existing trend. The stock may correct in the near term due to a developing divergence in RSI peaks. If so, there is support around 35.90 and 34.40 dollars. However, if the existing trend continues, the next price target could be around its previous top at 46.20 dollars, which is nearly 22 per cent from the last close. The stock is assessed as technically slightly positive for the medium term.
Investtech's outlook (one to six months): Weak Buy
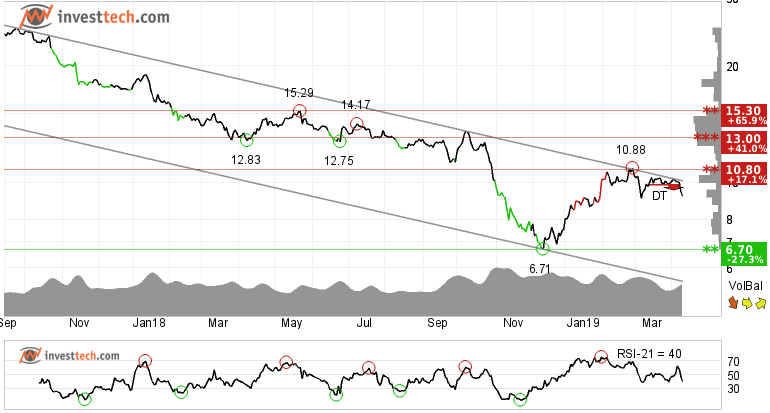
General Electric (GE.US500) Close: 9.22
General Electric is in a falling trend channel in all time frames, from short to long term. This signals increasing pessimism among investors. The stock has been in a falling trend since the beginning of 2017 and has fallen by more than 70 per cent.
Recently the stock tested resistance at the ceiling of the falling trend channel and gave a sell signal from a small double top formation. An established break and close below 9.10 may give another opportunity to sellers to be further bearish on the stock.
There is support around 6.70 dollars while resistance is around the 10.30 - 10.80 levels.
Investtech's outlook (one to six months): Sell
The analyses are based on closing price as per April 9, 2019
Note: These instruments are traded in currency based on the exchange or country they are listed on.
Written by

Analyst - Investtech
"Investtech analyses the psychology of the market and gives concrete trading suggestions every day."

Partner & Senior Advisor - Investtech
Investtech guarantees neither the entirety nor accuracy of the analyses. Any consequent exposure related to the advice / signals which emerge in the analyses is completely and entirely at the investors own expense and risk. Investtech is not responsible for any loss, either directly or indirectly, which arises as a result of the use of Investtechs analyses. Details of any arising conflicts of interest will always appear in the investment recommendations. Further information about Investtechs analyses can be found here disclaimer.
The content provided by Investtech.com is NOT SEC or FSA regulated and is therefore not intended for US or UK consumers.


 Oslo Børs
 Stockholmsbörsen
 Københavns Fondsbørs
 Helsingin pörssi
 World Indices
 US Stocks
 Toronto Stock Exchange
 London Stock Exchange
 Euronext Amsterdam
 Euronext Brussel
 DAX
DAX CAC 40
 Mumbai S.E.
 Commodities
 Currency
 Cryptocurrency
 Exchange Traded Funds
 Investtech Indices


