Global stocks: Two buy candidates from Top 50 list of Nasdaq 100
Published December 11, 2019
We have analysed two stocks from the Top 50 list of Nasdaq 100 available on Investtech's website. The stocks making it to the Top 50 list are ones that have scored highest on technical parameters.
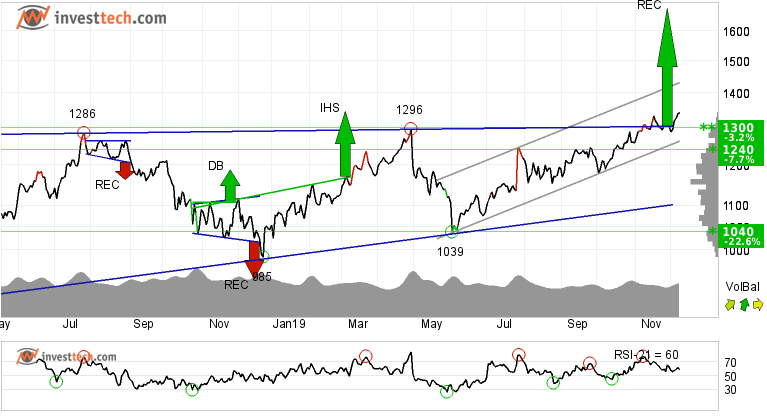
Alphabet Inc (GOOGL.NAS100) Close: 1342.99
A sideways price movement, that stretched for almost two years, is finally broken. Alphabet Inc. has given a buy signal from a rectangle formation both in the medium and long term charts. This indicates that the long term sluggish perspective of the investors has now taken a heads up and more and more people are now interested in buying the stock. Further rise to 1678 dollars or more is signalled.
The stock has also broken up through resistance at 1300 dollars and further rise in the stock is expected. There is no resistance in the price chart whatsoever and further rise is indicated. In case of a negative reaction, the stock has support at the same level.
The current movement is positive with an overweight of optimists over pessimists. Further rise in stock price is expected.
We last analysed the stock on October 30, when the price had closed at 1262.62 dollars, and gave a weak positive recommendation. We now upgrade our recommendation to positive for Alphabet Inc.
Investtech's outlook (one to six months): Positive
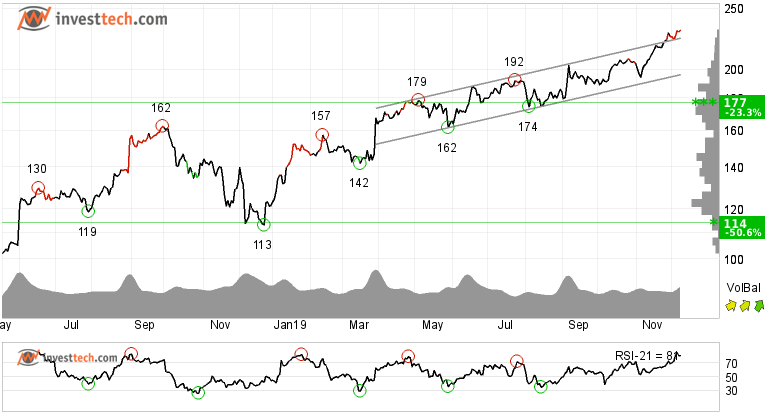
Lululemon Athletica inc (LULU.NAS100) Close: 230.88
Investors have paid higher prices over time to buy Lululemon Athletica inc. and the stock has broken the rising trend up in the medium long term, which indicates an even stronger rising rate. Investtech had done a lot of research in the area regarding position of price with respect to the trend channel, support and resistance and the average return for stocks with respect to the broader index in the Scandinavian markets. More about the research can be studied here.
The athletic giant is trading near its all time high. Hence no significant resistance is visible in the charts. In case of any downward reaction, there is support around 217 dollars in the short term.
Positive volume balance shows that volume is higher on days with rising prices than days with falling prices. This indicates increasing optimism among investors. RSI is above 70 after a good price increase the past weeks. The stock has strong positive momentum and further increase is indicated.
Investtech's outlook (one to six months): Positive
The analyses are based on closing price as per December 9, 2019.
These instruments are traded in currency based on the Exchange or country they are listed on.
Written by

Analyst - Investtech
"Investtech analyses the psychology of the market and gives concrete trading suggestions every day."

Partner & Senior Advisor - Investtech
Investtech guarantees neither the entirety nor accuracy of the analyses. Any consequent exposure related to the advice / signals which emerge in the analyses is completely and entirely at the investors own expense and risk. Investtech is not responsible for any loss, either directly or indirectly, which arises as a result of the use of Investtechs analyses. Details of any arising conflicts of interest will always appear in the investment recommendations. Further information about Investtechs analyses can be found here disclaimer.
The content provided by Investtech.com is NOT SEC or FSA regulated and is therefore not intended for US or UK consumers.


 Oslo Børs
 Stockholmsbörsen
 Københavns Fondsbørs
 Helsingin pörssi
 World Indices
 US Stocks
 Toronto Stock Exchange
 London Stock Exchange
 Euronext Amsterdam
 Euronext Brussel
 DAX
DAX CAC 40
 Mumbai S.E.
 Commodities
 Currency
 Cryptocurrency
 Exchange Traded Funds
 Investtech Indices


