Research results India - Rectangle formations
Published 23 April 2019
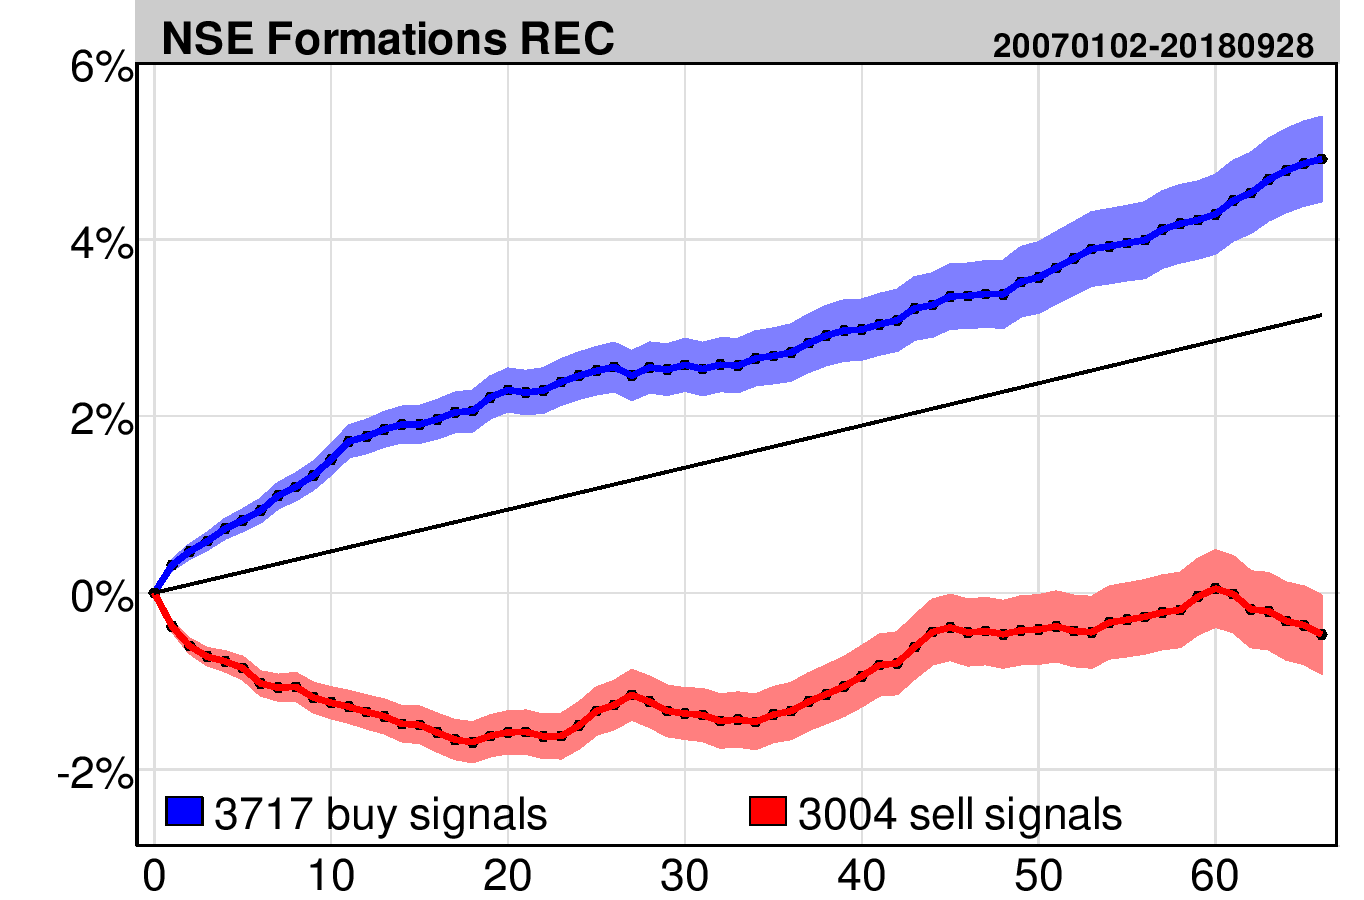
A new research report from Investtech based on 12 years of data from the National Stock Exchange in India shows that stocks with buy signal from rectangle formations on average have risen by 4.9 per cent after three months, while stocks with sell signal from rectangle formations have fallen 0.5 per cent.
Rectangle formations are created in stock prices when buyers and sellers of the stock are balanced over time. Technical analysis theory suggests that investor psychology is about to change when the price breaks out from such formations.

Figure 1: Buy signal from rectangle formation.

Figure 2: Sell signal from rectangle formation.
A break upwards from a rectangle formation triggers a buy signal and a break downwards triggers a sell signal. Investtech’s Head of Research and Analysis, Mr. Geir Linløkken, has studied the price movements that have followed from buy and sell signals from rectangle formations on the National Stock Exchange in India over a period of 12 years, from 2007 to 2018.
Investtech’s computers identified a total of 3,717 buy signals and 3,004 sell signals in this period.

Click the image for bigger version.
The chart shows average price development following buy and sell signals from rectangle formations on the National Stock Exchange in India identified by Investtech's automatic algorithms in medium long term charts. The signals are triggered on day 0. Only days when the exchange is open are included, so 66 days equal approximately 3 months. Buy signals are the blue line and the sell signals are the red one. The shaded areas show the standard deviation for these calculations. The black line is the benchmark index.
On average, stocks with buy signals increased by 4.9 % after 3 months, whereas stocks with sell signals fell by 0.5 %. Compared to the average stock exchange development in the same period, the buy signals did 1.8 percentage points better and the sell signals did 3.6 percentage points worse. Consequently buy signals gave an annualized excess return of 8.0 percentage points and sell signals an annualized negative excess return of 15.0 percentage points.
Please find more results and details in the research report here.
Keywords: Buy signal,National Stock Exchange India,NSE,REC,rectangle,rectangle formation,Sell signal,statistics.
Written by

Head of Research and Analysis
at Investtech
"Investtech analyses the psychology of the market and gives concrete trading suggestions every day."

Partner & Senior Advisor - Investtech
Investtech guarantees neither the entirety nor accuracy of the analyses. Any consequent exposure related to the advice / signals which emerge in the analyses is completely and entirely at the investors own expense and risk. Investtech is not responsible for any loss, either directly or indirectly, which arises as a result of the use of Investtechs analyses. Details of any arising conflicts of interest will always appear in the investment recommendations. Further information about Investtechs analyses can be found here disclaimer.
The content provided by Investtech.com is NOT SEC or FSA regulated and is therefore not intended for US or UK consumers.


 Oslo Børs
 Stockholmsbörsen
 Københavns Fondsbørs
 Helsingin pörssi
 World Indices
 US Stocks
 Toronto Stock Exchange
 London Stock Exchange
 Euronext Amsterdam
 Euronext Brussel
 DAX
DAX CAC 40
 Mumbai S.E.
 Commodities
 Currency
 Cryptocurrency
 Exchange Traded Funds
 Investtech Indices


