Rising and falling trends – return in the following three months
Published in English on 31 May 2016. Norwegian original here >>
Written by Asbjørn Taugbøl and Geir Linløkken.
Investtech has worked on research into behavioural finance and technical and quantitative stock analysis since 1997. The company has developed an analysis system that identifies trends, support and resistance, formations and volume patterns in stock prices, and uses these to generate buy and sell signals. Investtech uses advanced mathematical algorithms and statistical methods in computer programmes and online subscription services. Mr. Asbjørn Taugbøl is a researcher and senior analyst with Investtech. Mr. Geir Linløkken is Head of Research & Development.
Keywords:
Finance, technical analysis, trend, buy signals, price prediction.
Abstract:
Trends are some of the most important elements in the theory of technical analysis, and are widely used by investors as a basis for investment decisions. A rising trend is the result of investors’ on-going optimism. The theory says that stocks in a rising trend will continue to move within the trend. To what extent is this true and can it be used to achieve excess return? Investtech’s research into data from 1996 to 2015 for the Oslo and Stockholm Stock Exchanges shows that stocks in rising trends identified by Investtech’s automatic analysis systems have yielded significantly better return than benchmark in the following months.
Trends
Trends are one of the most important elements of technical analysis. They are visual and intuitive and describe in which direction a stock is moving. A rising trend indicates lasting and increasing optimism among investors, often as a result of a great deal of positive news about the stock.
The trend gives the rate of increase for the stock price, and extrapolating trend lines gives the price target for the stock. There are gradual transitions between rising trends, horisontal trends and falling trends.
The literature on the subject states that "The trend is your friend", meaning that stocks in rising trends will continue to rise within the trend channel. This makes it important to identify and buy stocks as early as possible after a rising trend is established.
Identifying a trend requires studying the price movements. Stock prices rarely move in a straight line. Instead they move in a series of tops and bottoms. Drawing a straight line through two or more rising bottoms produces the support line in a rising trend. See figure 1. Continue to draw a line parallel to the support line thought the rising tops. This line is called the trend’s resistance line. Support and resistance lines combined make up the trend, see figure 2
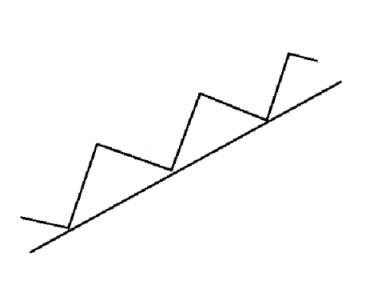
Figure 1. Support line in a rising trend.

Figure 2. Rising trend with support line and resistance line.
Similarly, a falling trend is produced when a straight line can be drawn through two or more falling tops and a parallel line through falling bottoms.
Many investors identify trends by studying charts and drawing trend lines by hand. This method has many weaknesses, the most important of which is that it is subjective. You see the trends you want to see and which perhaps fit your own subconscious preferences. It is also a very time consuming method. Investtech has developed automatic algorithms for identification of trends. Every day these algorithms identify the “best” trend in the chart, on criteria such as distance between the trend’s support and resistance lines and the number of data points near these lines. Roughly 80,000 various trend alternatives are assessed each day for a medium term Investtech chart with 18 months of historical data. These are given a score and the best trend is selected.

Figure 3. Rising trend where a stock with positive fundamental development over time varies between pricing of P/E=12, which many investors think is cheap, and P/E=15, which many investors think is expensive.
Investtech's help pages on trends and other technical indicators are located under the Insight & Skills tab. You can also see which of the big companies are in rising trends right now.
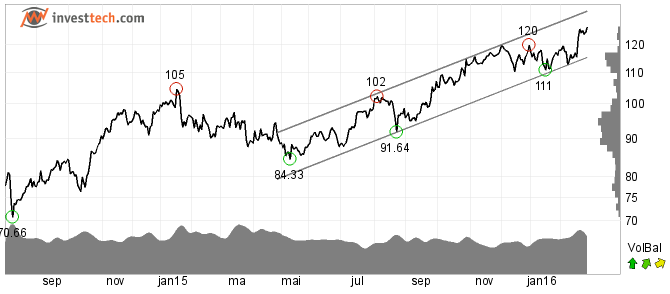
Figure 4. Example of rising trend identified by Investtech’s systems. Marine Harvest in February 2016. The stock is in a rising trend channel, has triggered a buy signal from a rising trend, and the rise is indicated to continue.
The Research Project
This report is based on a research project into trends and what happens to stocks that are in rising and falling trends. The work is part of a bigger project on analysis of technical signals, supported by the Norwegian Research Council.
The Data and Signals
The data used are historical prices for companies listed on the Oslo Stock Exchange in the period 1 Jan. 1996 - 31 Dec. 2015 and the companies on the Stockholm Stock Exchange in the period 1 April 2003 - 31 Dec. 2015. Only analyses for companies where average daily turnover in the past 22 days was over NOK 0.5m are included.
Stock prices are adjusted for splits, subscription rights, mergers, dividend payments and other corporate actions, to ensure that the price development mirrors the actual value of the companies. All companies that have been listed on the exchange in the time period studied are included, also companies than are no longer listed today.
Benchmark for the analysis of companies listed on the Oslo Stock Exchange is the OSEBX. For the Swedish Stock Exchange, benchmark is the OMX Stockholm Benchmark GI, OMXSBGI.
We have looked at stocks that have been in rising and falling trends in the medium long term according to Investtech’s charts. A stock in a rising trend has triggered a buy signal, and a stock in a falling trend has triggered a sell signal. When a stock had been in a rising or falling trend for a long time, at least 22 trading days were required before the stock would trigger a new signal in the same direction.
A rising trend is defined by a rate of increase of more than 10 degrees and a falling trend is defined by a rate of increase of less than -10 degrees. This means different annual rising rate for different stocks, depending on the volatility of the stock and the variation range of the charts.
| Number | Norway | Sweden | Total |
| Buy signal, stock in rising trend | 10,906 | 17,674 | 28,580 |
| Sell signal, stock in falling trend | 7,241 | 9,107 | 16,348 |
The data samples are not statistically independent. A stock in a rising trend can trigger several signals, one for every 22nd day the stock remains in the trend. Analysis of price development 66 days forwards in time, means that such signals may overlap somewhat. In addition, there is covariance between stocks. If the Exchange, or a specific stock, rises, other stocks will be more likely to rise too, which means the price development is not statistically independent.
However, the data set is considered big enough that an analysis will give statistically significant results.
Results
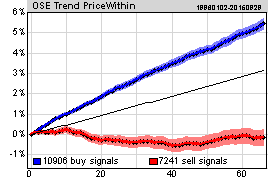
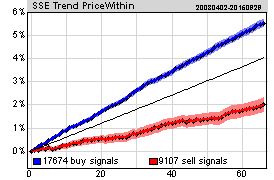
We have looked at how stocks which were in a rising or falling trend at one point in time have developed in the following three months. Stocks in rising trends were assigned buy signals and stocks in falling trends were assigned sell signals.
| Average return after 66 days | Norway | Sweden | Weighted average |
| Buy signal, stock in rising trend | 5.4% | 5.5% | 5.5% |
| Sell signal, stock in falling trend | -0.1% | 2.0% | 0.9% |
| Benchmark | 3.1% | 4.0% | 3.6% |
Stocks that were in rising trends at a point time, have on average had clearly positive price development over the next 66 days, and price development decidedly better than average benchmark development. At the same time, stocks in falling trends have had a price development over the next 66 days much weaker than that of the average benchmark index.
The calculations are done based on a large data set for a relatively long period of time, and for two different countries. The uncertainty of the estimate, measured by standard deviation, is relatively low, with statistical T-values from 6.0 to 10.7 for each of the four data sets. Thus results are considered robust, despite the lack of independence between samples.
Conclusion
Stocks with buy signal from rising trend have consistently given good results over time, with excess return compared to benchmark.
Based on historical prices for stocks on the Oslo Stock Exchange in the period 1996 to 2015 and the Stockholm Stock Exchange from 2003 to 2015, stocks that have been in rising trends have clearly outperformed the benchmark indices in the following three months. Similarly stocks that have been in falling trends have underperformed.
The trends are identified by Investtech’s automated systems over a relatively long period of time. This gives a large number of signals, so the data are considered good and the results statistically significant.
Most well functioning stock markets are influenced by the same mechanisms as the Norwegian and Swedish ones. The underlying psychological drivers, in particular, with greed and fear as key factors, are assumed to be the same worldwide. Thus there is no reason to believe that the main findings of this report will not also be valid for other markets.
Keywords: Buy signal,Finance,Oslo,Price prediction,Stockholm,Technical analysis,Trend.
Written by

Analyst
at Investtech
"Investtech analyses the psychology of the market and gives concrete trading suggestions every day."

Partner & Senior Advisor - Investtech
Investtech guarantees neither the entirety nor accuracy of the analyses. Any consequent exposure related to the advice / signals which emerge in the analyses is completely and entirely at the investors own expense and risk. Investtech is not responsible for any loss, either directly or indirectly, which arises as a result of the use of Investtechs analyses. Details of any arising conflicts of interest will always appear in the investment recommendations. Further information about Investtechs analyses can be found here disclaimer.
The content provided by Investtech.com is NOT SEC or FSA regulated and is therefore not intended for US or UK consumers.


 Oslo Børs
 Stockholmsbörsen
 Københavns Fondsbørs
 Helsingin pörssi
 World Indices
 US Stocks
 Toronto Stock Exchange
 London Stock Exchange
 Euronext Amsterdam
 Euronext Brussel
 DAX
DAX CAC 40
 Mumbai S.E.
 Commodities
 Currency
 Cryptocurrency
 Exchange Traded Funds
 Investtech Indices