
 Oslo Børs
 Stockholmsbörsen
 Københavns Fondsbørs
Investeringsforeninger
Københavns Fondsbørs
Investeringsforeninger
 Helsingin pörssi
 World Indices
 US Stocks
US 30
Nasdaq 100
US 500
US Stocks
US 30
Nasdaq 100
US 500
 Toronto Stock Exchange
 London Stock Exchange
 Euronext Amsterdam
 Euronext Brussel
 DAX
SDAX
TECDAX
Frankfurt
CDAX
MDAX
Prime Standard
DAX
SDAX
TECDAX
Frankfurt
CDAX
MDAX
Prime Standard
 CAC 40
 Mumbai S.E.
National S.E.
Mumbai S.E.
National S.E.
 Commodities
 Currency
 Cryptocurrency
 Exchange Traded Funds
 Investtech Indices
Morning Report Apr 19, 2024
Buy: NASDAQ
Weak buy: SEOUL STOXX
Weak sell: SSEC
Watch: TORONTO NIFTY
NASDAQ (Price Apr 18, 2024: 15601)Buy
Buy
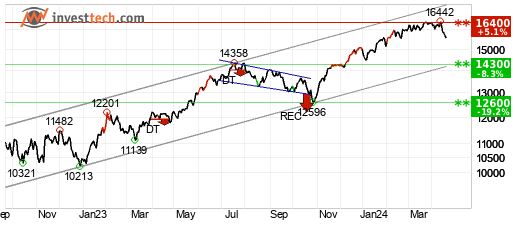 NASDAQ shows strong development within a rising trend channel in the medium long term. Rising trends indicate that the market experiences positive development and that buy interest among investors is increasing. However, the price has broken a support level in the short term and given a negative signal for the short term trading range. The index has support at points 14300 and resistance at points 16400. The RSI curve shows a falling trend, which is an early signal of a possible trend reversal downwards for the price as well. The index is overall assessed as technically positive for the medium long term.
Extended analysis
KOSPI (Price Apr 18, 2024: 2591.86)Weak buy
Weak buy
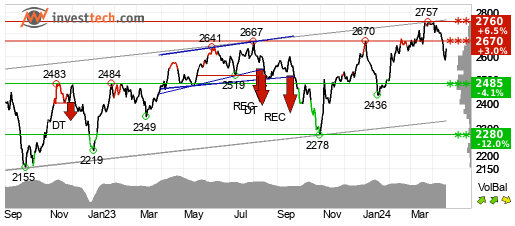 Investors have paid higher prices over time to buy KOSPI and the index is in a rising trend channel in the medium long term. Rising trends indicate that the market experiences positive development and that buy interest among investors is increasing. The index has broken a support level in the short term and given a negative signal for the short term trading range. The index has support at points 2485 and resistance at points 2670. The index is overall assessed as technically slightly positive for the medium long term.
Extended analysis
Euro Stoxx 50 (Price Apr 18, 2024: 4936.57)Weak buy
Weak buy
 Investors have paid higher prices over time to buy Euro Stoxx 50 and the index is in a rising trend channel in the medium long term. This signals increasing optimism among investors and indicates continued rise. The index is approacing resistance at 5080 points, which may give a negative reaction. However, a break upwards through 5080 points will be a positive signal. The index is assessed as technically slightly positive for the medium long term.
Extended analysis
Shanghai Composite (Price Apr 18, 2024: 3065.26)Weak sell
Weak sell
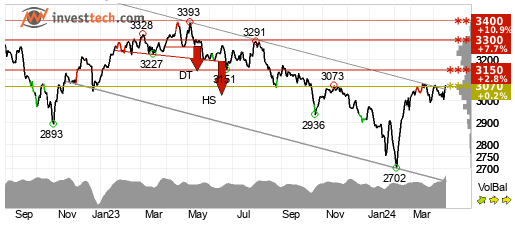 Shanghai Composite has broken the ceiling of the falling trend in the medium long term, which indicates a slower initial falling rate. The index is testing resistance at points 3070. This could give a negative reaction, but an upward breakthrough of points 3070 means a positive signal. RSI diverges negatively against the price, which indicates danger of a reaction downwards. The index is overall assessed as technically slightly negative for the medium long term.
Extended analysis
Toronto (Price Apr 18, 2024: 21708)Watch
Watch
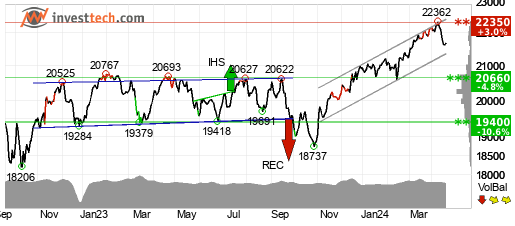 Toronto shows strong development within a rising trend channel in the medium long term. This signals increasing optimism among investors and indicates continued rise. The index has support at points 20660 and resistance at points 22350. The index is assessed as technically neutral for the medium long term.
Extended analysis
Nifty 50 (Price Apr 18, 2024: 21996)Watch
Watch
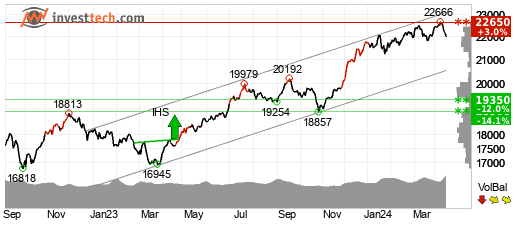 Nifty 50 shows strong development within a rising trend channel in the medium long term. This signals increasing optimism among investors and indicates continued rise. The index has support at points 19350 and resistance at points 22650. Volume tops and volume bottoms correspond badly with tops and bottoms in the price. This weakens the rising trend and could be an early signal of a coming trend break. The index is overall assessed as technically neutral for the medium long term.
Extended analysis
The report consists of daily evaluations by Investtech´s automated analysis system. The selection is mainly based on new medium term technical signals from the last closing price.


Investtech guarantees neither the entirety nor accuracy of the analyses. Any consequent exposure related to the advice / signals which emerge in the analyses is completely and entirely at the investors own expense and risk. Investtech is not responsible for any loss, either directly or indirectly, which arises as a result of the use of Investtechs analyses. Details of any arising conflicts of interest will always appear in the investment recommendations. Further information about Investtechs analyses can be found here disclaimer.
The content provided by Investtech.com is NOT SEC or FSA regulated and is therefore not intended for US or UK consumers.
Head office
Strandveien 171366 Lysaker, Norway
Research department
Instituttveien 102007 Kjeller, Norway
×
