
 Oslo Børs
 Stockholmsbörsen
 Københavns Fondsbørs
Investeringsforeninger
Københavns Fondsbørs
Investeringsforeninger
 Helsingin pörssi
 World Indices
 US Stocks
US 30
Nasdaq 100
US 500
US Stocks
US 30
Nasdaq 100
US 500
 Toronto Stock Exchange
 London Stock Exchange
 Euronext Amsterdam
 Euronext Brussel
 DAX
SDAX
TECDAX
Frankfurt
CDAX
MDAX
Prime Standard
DAX
SDAX
TECDAX
Frankfurt
CDAX
MDAX
Prime Standard
 CAC 40
 Mumbai S.E.
National S.E.
Mumbai S.E.
National S.E.
 Commodities
 Currency
 Cryptocurrency
 Exchange Traded Funds
 Investtech Indices
Morning Report Apr 29, 2024
Weak buy: NASDAQ
Buy: NIKKEI NIFTY
Watch: SYDNEY SSEC NYA
NASDAQ (Price Apr 26, 2024: 15928)Weak buy
Weak buy
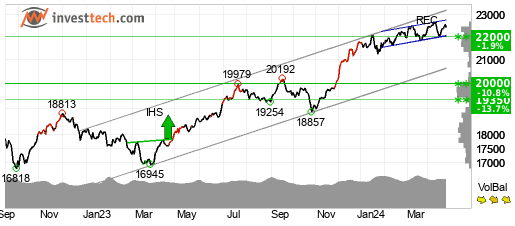
 NASDAQ is in a rising trend channel in the medium long term. This shows that investors over time have bought the index at higher prices and indicates good development for the market. The index is approacing resistance at 16400 points, which may give a negative reaction. However, a break upwards through 16400 points will be a positive signal. RSI diverges negatively against the price, which indicates danger of a reaction downwards. The RSI curve shows a falling trend, which is an early signal of a possible trend reversal downwards for the price as well. The index is overall assessed as technically slightly positive for the medium long term.
Extended analysis
Nikkei 225 (Price Apr 26, 2024: 37935)Buy
Buy
 Nikkei 225 is in a rising trend channel in the medium long term. This shows that investors over time have bought the index at higher prices and indicates good development for the market. The price has risen strongly since the positive signal from the rectangle formation at the break through resistance at 33592. The objective at 36440 is now met, but the formation still gives a signal in the same direction. The index has support at points 33600 and resistance at points 40900. Volume tops and volume bottoms correspond well with tops and bottoms in the price. This strengthens the trend. The index is overall assessed as technically positive for the medium long term.
Extended analysis
Nifty 50 (Price Apr 26, 2024: 22420)Buy
Buy
 Nifty 50 is in a rising trend channel in the medium long term. This shows that investors over time have bought the index at higher prices and indicates good development for the market. The index is moving within a rectangle formation between support at 22050 and resistance at 22766. A decisive break through one of these levels indicates the new direction for the index. The index is approaching support at 22000 points, which may give a positive reaction. However, a break downwards through 22000 points will be a negative signal. Volume tops and volume bottoms correspond badly with tops and bottoms in the price. This weakens the rising trend and could be an early signal of a coming trend break. The index is overall assessed as technically positive for the medium long term.
Extended analysis
Sydney (Price Apr 26, 2024: 7902.30)Watch
Watch
 Sydney has broken the floor of the rising trend channel in the medium long term, which indicates a weaker initial rising rate. The index has support at points 7670 and resistance at points 8150. Volume tops and volume bottoms correspond badly with tops and bottoms in the price. This weakens the index. The RSI curve shows a falling trend, which could be an early signal of the start of a falling trend for the price as well. The index is overall assessed as technically neutral for the medium long term.
Extended analysis
Shanghai Composite (Price Apr 26, 2024: 3112.85)Watch
Watch
 Shanghai Composite has broken the ceiling of the falling trend in the medium long term, which indicates a slower initial falling rate. The index has broken a resistance level in the short term and given a positive signal for the short-term trading range. The index is between support at points 3070 and resistance at points 3150. A definitive break through of one of these levels predicts the new direction. The index is overall assessed as technically neutral for the medium long term.
Extended analysis
NYSE Composite (Price Apr 26, 2024: 17763)Watch
Watch
 NYSE Composite has broken the floor of the rising trend channel in the medium long term, which indicates a weaker initial rising rate. The index has support at points 16150 and resistance at points 18300. Volume has previously been low at price tops and high at price bottoms. This weakens the index. The RSI curve shows a falling trend, which could be an early signal of the start of a falling trend for the price as well. The index is overall assessed as technically neutral for the medium long term.
Extended analysis
The report consists of daily evaluations by Investtech´s automated analysis system. The selection is mainly based on new medium term technical signals from the last closing price.


Investtech guarantees neither the entirety nor accuracy of the analyses. Any consequent exposure related to the advice / signals which emerge in the analyses is completely and entirely at the investors own expense and risk. Investtech is not responsible for any loss, either directly or indirectly, which arises as a result of the use of Investtechs analyses. Details of any arising conflicts of interest will always appear in the investment recommendations. Further information about Investtechs analyses can be found here disclaimer.
The content provided by Investtech.com is NOT SEC or FSA regulated and is therefore not intended for US or UK consumers.
Head office
Strandveien 171366 Lysaker, Norway
Research department
Instituttveien 102007 Kjeller, Norway
×
