PulteGroup (PHM.US500)
See Recommendation
Automatic technical analysis. Keskipitkä tähtäin, 3. touko 2024
Osakkeen kurssikehitys on vahvaa nousutrendin sisällä. Tämä indikoi positiivisen kehityksen jatkuvan ja tukea saadaan trendikanavan tukilinjan kohdalla. Osakkeen kurssi on tuki n. ca 104 $n kohdalla.Recommendation one to six months: See Recommendation
Learn more about key technical aspects of this stock:
 Trend
TrendRising trend
Rising trends indicate that the company experiences positive development and increasing buy interest among investors.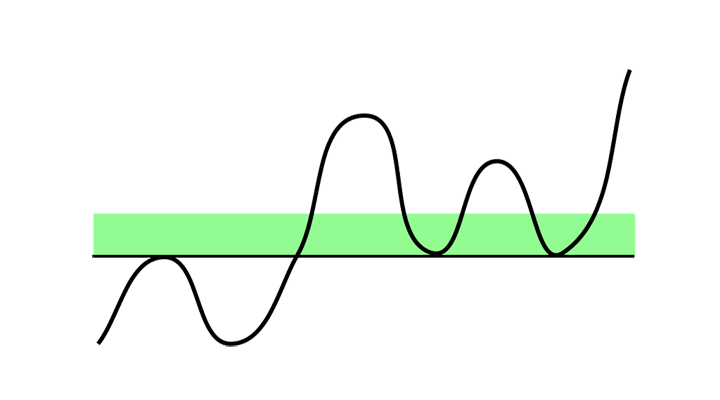 Support and resistance
Price above support
The price is above a support level, where the stock has previously turned upwards. Many investors may consider it cheap if it falls towards support again, and may then wish to buy.
Yhteistyökumppanit


investtechInMedia
Digital Investor

Dagbladet

Hegnar
E24
Placera
How Investtech works

Collect stock market data
Price, volume, insider information, corporate actions etc.

Perform advanced analysis
Using mathematical pattern recognition, statistical optimization and behavioural finance

Deliver actionable insights
Daily across the stocks, indices and commodities that matter most to your portfolio
Investtech by the numbers
Experience
26years
since 1997
Model portfolio
14.5%
average annual return
Analysis across
20+
stock exchanges
Recommendations of
30 000+
stocks, indices, currencies, cryptocurrencies and commodities
Hinnoittelu
Investor
Kaikki mitä tarvitset investointipäätösten suunnittelun aloittamiseen.
€
19
€
12
/ month
Billed Annually: € 149
Tilaus- Kaikkien Nasdaq, NYSE, AMEX Stock Exchanges osakkeiden analyysi
- Keskipitkän ja pitkän aikavälin kaaviot ⓘAnalyses for the medium and long term, respectively 1-6 months and 1-6 quarters investment perspective.
Keskipitkän ja pitkän aikavälin kaaviot → - Konkreettiset osto- ja myyntisignaalit ⓘSpecific buy and sell signals for each stock.
- Health Check ⓘGet a detailed portfolio health check.
- Päivän case ⓘPäivän Tapaus joka antaa teknisesti positiivisen valitun osakkeen.
- Top50 lista ⓘTop50 on lista, joka antaa 50 positiivisimmin tai negatiivisimmin tulkitun osakkeen järjestyksen.
Top50 lista → - Hintatasojen hälytykset
ⓘYou may enter a price alert for a stock and be notified when the price reaches this level.
Hintatasojen hälytykset →
Trader
Vie sijoituspäätöksesi uudelle tasolle lyhyen aikavälin analyyseillä ja edistyneemmillä työkaluilla.
€
49
€
29
/ month
Billed Annually: € 349
Tilaus- Kaikki Investor -tilauspalvelun ominaisuudet
- +
- Lyhyen aikavälin kaaviot ja analyysit ⓘAnalyses for the short term, 1-6 weeks investment perspective.
Lyhyen aikavälin kaaviot ja analyysit → - Aamuraportit ⓘRaportti sisältää Investtechin automaattisten analyysisysteemien kirjoittamia päivittäisiä suosituksia.
- Trendisignaalit ⓘThe Trend signals tool shows stocks that recently entered into a rising or falling trend.
Trendisignaalit → - Pivotpisteet ⓘPivot points are tops and bottoms in the chart.
Pivotpisteet → - Candlestick -kaaviot ⓘCandlestick analysis is the best tool for doing a detailed short term volume analysis.
Candlestick -kaaviot →
Professional
Laaja valikoima edistyneitä valintatyökaluja ja kokonaisanalyysiä investointien skaalaamiseksi.
€
119
€
74
/ month
Billed Annually: € 899
Tilaus- Kaikki Trader -tilauspalvelun ominaisuudet
- +
- Täysanalyysi ⓘOverall analysis for all time perspectives; long, medium and short term.
Täysanalyysi → - Osakevalinta ⓘStock selection is likely the best stock picking tool Investtech offers. The most common usage is to select liquidity and time perspective, e.g. 50 % most liquid and short term.
Osakevalinta → - Hausse ⓘThe Hausse indices are indicators of optimism.
Hausse → - Vertaa osakkeita ⓘVertaa 30,000 osakkeen, raaka-aineen ja indeksin kurssien kehitystä.
Vertaa osakkeita → - Kaupankäyntimahdollisuudet ⓘThe Trading opportunities table is a stock picking tool. The table shows stocks with combinations of technical indicators that strongly indicate further rise or fall.
Kaupankäyntimahdollisuudet → - Kausivaihtelut ⓘAnalysis of seasonal variations shows how a stock statistically has varied throughout the year.
Kausivaihtelut → - Lajittelu signaalien mukaan ⓘAn overview of the latest buy and sell signals identified by InvesttechÕs systems. Signals from price patterns are assumed to indicate in which direction the majority of investors are moving.
Lajittelu signaalien mukaan →
Institutional
Access to all 30,000 stocks, commodities and currencies, suited for experienced investment strategists.
- All Professional features
- +
- Kaikki 30,000 osaketta, raaka-ainetta ja valuuttaa ⓘAll 30,000 stocks, commodities and currencies.
- Itse määrittelemät kokonaisuudet ⓘDefine your own universe of stocks.
- Hälytykset ⓘOverview of the stocks in your universes that have triggered signals.
- Henkilökohtainen asiakaspalvelu teknisistä kysymyksistä ⓘContact your personal customer service representative with any technical questions you may have.
- Muokattavat valikointikriteerit ⓘWide range of flexible selection criteria.
Investtech ei takaa analyysien tarkkuutta tai kattavuutta. Kaikkien analyysien tuottamien neuvojen ja signaalien käyttäminen on täysin käyttäjän vastuulla. Investtech ei vastaa mistään tappioista, jotka saattavat syntyä Investtechin analyysien käytön seurauksena. Mahdollisten eturistiriitojen yksityiskohdat mainitaan aina sijoitusneuvon yhteydessä. Lisätietoja Investtechin analyyseistä löytyy täältä disclaimer.
Investtech ei takaa analyysien tarkkuutta tai kattavuutta. Kaikkien analyysien tuottamien neuvojen ja signaalien käyttäminen on täysin käyttäjän vastuulla. Investtech ei vastaa mistään tappioista, jotka saattavat syntyä Investtechin analyysien käytön seurauksena. Mahdollisten eturistiriitojen yksityiskohdat mainitaan aina sijoitusneuvon yhteydessä. Lisätietoja Investtechin analyyseistä löytyy täältä disclaimer.


 Oslo Børs
 Stockholmsbörsen
 Københavns Fondsbørs
 Helsingin pörssi
 World Indices
 US Stocks
 Toronto Stock Exchange
 London Stock Exchange
 Euronext Amsterdam
 Euronext Brussel
 DAX
DAX CAC 40
 Mumbai S.E.
 Commodities
 Currency
 Cryptocurrency
 Exchange Traded Funds
 Investtech Indices