Support and Resistance: Good sell signals from stocks that are far below resistance and lack support
Published 26 September 2019
Stocks that are far below resistance and lack support have done very poorly in the following period. Despite these being considered theoretically neutral situations, our research results show that statistically they are very good sell signals.
According to technical analysis theory, support and resistance are among the most central concepts in technical analysis and can in theory be used to find good buy and sell levels.
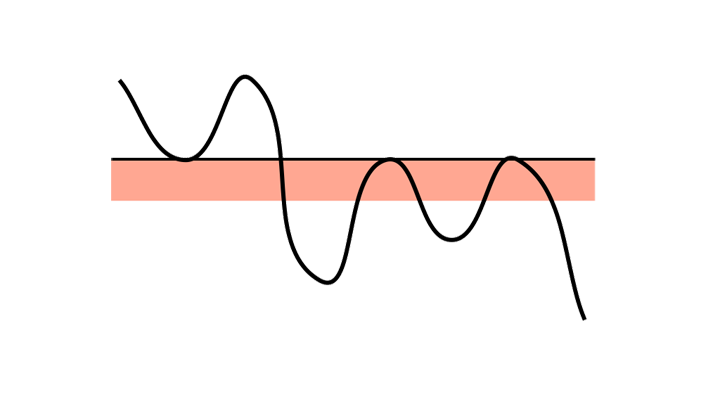
 Figure 1: The price is below a resistance level, where the stock has previously turned downwards. Many investors may consider it expensive if it rises up to resistance, and may then wish to sell.
Resistance is a level where many sellers are thought to become active. It is normally assumed that the stock will not rise above the resistance level. Resistance is thus often used to calculate the upside potential of a stock, especially for short term investors. A stock with a long way up to resistance has a bigger upside potential than a stock near resistance.
Especially in falling and horizontal trends, resistance expresses the upside potential in the stock. If, at the same time, there is little to no support below the current price, the downside potential tends to be big.
Research results
We have studied return from Norwegian, Swedish, Danish and Finnish stocks following signals triggered by stocks' movements in relation to support and resistance levels in technical price charts. We used support and resistance levels automatically identified in Investtech’s medium term price charts. We had 23 years of data, from 1996 to 2018.
The chart below shows average price development following sell signals from stocks far below resistance and lacking support in Investtech’s medium term price charts. The signals are triggered on day 0. Only days when the exchange is open are included, so 66 days equal approximately three months. The thick red line shows the development of sell signal stocks. The shaded areas are the standard deviation of the calculations. The thin red line shows benchmark development in the same period as the sell signal stocks.
Figure 2: Return following sell signals from stocks far below resistance and lacking support identified in Investtehc’s medium term price charts. The thick red line is signal stocks, thin red line is benchmark, the Nordic markets, 1996-2018.
| Annualised return (based on 66-day figures) | Norway | Sweden | Denmark | Finland | Weighted average |
| Sell signal | -7.0 % | -1.3 % | -11.6 % | -2.6 % | -4.6 % |
| Benchmark in same period | 4.4 % | 5.9 % | -1.9 % | -6.1 % | 3.1 % |
| Excess return sell signal | -11.3 pp | -7.2 pp | -9.7 pp | 3.5 pp | -7.6 pp |
The chart and table show that stocks with sell signal because they are below resistance and lack support on average have fallen in the following period. Three months after the sell signal was triggered, the sell signal stocks had on average fallen 1.2 per cent, equal to 2.0 percentage points weaker than benchmark.
The data set is large with 19,586 signals over a period of up to 23 years. Statistical t-value is 8.7, suggesting high statistical significance.
Article on buy signals:
Buy signal when stock is above support and lacks resistance
Read more in the research report here.
Kirjoittaja

Perustaja ja tutkimustyön johtaja
Investtech
Research articles:
Support and Resistance: Research results cause doubt about buy signals
Support and Resistance: Profitable to buy stocks that are near resistance
Support and Resistance: Break upwards through resistance is a buy signal
Support and Resistance: Break downwards through support is a sell signal
Support and Resistance: Buy signal when stock is above support and lacks resistance
Support and Resistance: Good sell signals from stocks that are far below resistance and lack support
Further research articles will be published as soon as possible.
Please note:
Changes to Support and Resistance algorithms
Insight & Skills:
"Investtech analysoi markkinoiden psykologiaa ja antaa konkreettisia kaupankäyntisuosituksia päivittäin."

Partner & Senior Advisor - Investtech
Investtech ei takaa analyysien tarkkuutta tai kattavuutta. Kaikkien analyysien tuottamien neuvojen ja signaalien käyttäminen on täysin käyttäjän vastuulla. Investtech ei vastaa mistään tappioista, jotka saattavat syntyä Investtechin analyysien käytön seurauksena. Mahdollisten eturistiriitojen yksityiskohdat mainitaan aina sijoitusneuvon yhteydessä. Lisätietoja Investtechin analyyseistä löytyy täältä disclaimer.
Investtech ei takaa analyysien tarkkuutta tai kattavuutta. Kaikkien analyysien tuottamien neuvojen ja signaalien käyttäminen on täysin käyttäjän vastuulla. Investtech ei vastaa mistään tappioista, jotka saattavat syntyä Investtechin analyysien käytön seurauksena. Mahdollisten eturistiriitojen yksityiskohdat mainitaan aina sijoitusneuvon yhteydessä. Lisätietoja Investtechin analyyseistä löytyy täältä disclaimer.


 Oslo Børs
 Stockholmsbörsen
 Københavns Fondsbørs
 Helsingin pörssi
 World Indices
 US Stocks
 Toronto Stock Exchange
 London Stock Exchange
 Euronext Amsterdam
 Euronext Brussel
 DAX
DAX CAC 40
 Mumbai S.E.
 Commodities
 Currency
 Cryptocurrency
 Exchange Traded Funds
 Investtech Indices


