Investtech Research: Return following signals from inverse/head and shoulders formations in stock prices - medium term, Nordic markets 1996-2018
Research report written by Mr. Geir Linløkken, Head of Research at Investtech.
Published: 12 November 2019
Abstract:
Geometric price patterns, like inverse/head and shoulders formations, are used in technical analysis to predict future price development. Many investors use this as an important part of their decision making process when buying or selling stocks. We have studied the price movements that followed buy and sell signals from inverse/head and shoulders formations in Investtech’s medium term price charts for the Norwegian, Swedish, Danish and Finnish Stock Exchanges in a period of 23 years, from 1996 to 2018. The strongest results were after 22 days. Excess return vs benchmark after 22 days for buy signal stocks was 1.0 percentage points and negative excess return for sell signal stocks was 0.8 percentage points. Annualised excess return was 13.7 and -9.8 for buy and sell signals respectively.
Keywords: head and shoulders formation, inverse head and shoulders formation, buy signal, sell signal, Oslo Stock Exchange, Stockholm Stock Exchange, Copenhagen Stock Exchange, Helsinki Stock Exchange, Norway, Sweden, Denmark, Finland, the Nordic countries, statistics, technical analysis
About Investtech
Investtech is a Norwegian analysis company focussing on technical and quantitative analysis. The company was established in 1997 to develop and sell stock analysis systems built on new technology and scientific methods. Research into signals from technical analysis and other topics in behavioural finance, where human psychology is an important variable, is central to the company. Investtech delivers morning reports to subscribers in Norway, Sweden, Denmark and Finland. We also provide services for most other big markets in the world and daily analyse approximately 30,000 stocks. Each stock is assigned a concrete recommendation given as Positive, Negative or Watch. Subscriptions can be purchased from the company’s website.
About the author
Geir Linløkken is the Head of Analysis and Research at Investtech. He founded Investtech in 1997, to provide independent technical analyses based on science and investor psychology. Mr. Linløkken holds an MSc. in Computer Science, specializing in Mathematical Modeling, at the University of Oslo. He is the author of the book “Technical Stock Analysis”. Mr. Linløkken is responsible for model portfolios, morning reports and other of Investtech’s stock recommendations, and work on a daily basis with analysis and the development of quantitative methods for stock market investments.
Research into technical price formations
This research report is part of a bigger research project conducted by Investtech into technical signals in stock prices. The project is supported by the Norwegian Research Council via SkatteFunn, and Investtechs receives support for the years 2019 and 2020.
This report is on medium term inverse/head and shoulders formations on the Stock Exchanges in Norway, Sweden, Denmark and Finland.
| Short term | Medium term | Long term | |
| Rectangle | Report | Report | Report |
| Inverse/head and shoulders | Report | Present | Report |
| Double top/bottom | Report | Report | Report |
Head and shoulders formations
Identification of geometric price patterns in stock prices is an important area of technical analysis. The idea is that these patterns describe the investors’ mental state, i.e. whether they will want to sell or buy stocks in the time ahead, and they thereby indicate the future direction of the stock price. Head and shoulders formations are one type of such patterns.
A head and shoulders formation is a top formation which marks the end of a rising period. The formation consists of a left shoulder, a head and a right shoulder, connected by a neckline, see figure 1a. The creation of a head and shoulders formation indicates increasing pessimism among investors and the start of a falling trend. Such formations are considered among the most reliable signals in technical analysis. They are primarily used to predict reversals in long term market trends, but can also be used in the shorter term.
This formation also exists in the opposite direction, as an inverse head and shoulders formation, see figure 1b. This is a bottom formation which marks the end of a falling period. An inverse head and shoulders formation signals increasing optimism among investors and the start of a rising trend.
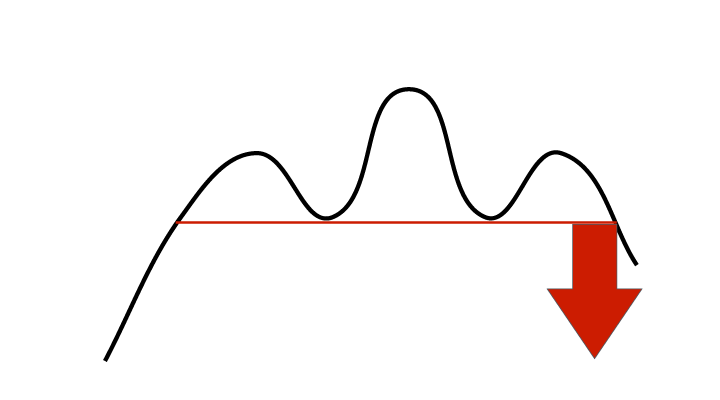
Figure 1a: Sell signal from head and shoulders formation.
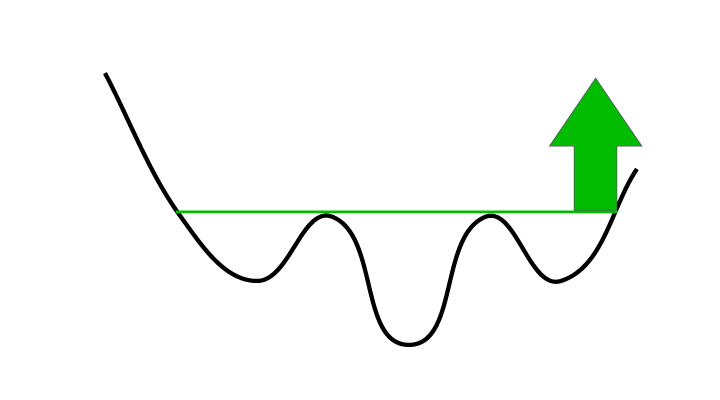
Figure 1b: Buy signal from inverse head and shoulders formation.
In technical analysis terminology, a break downwards through the neckline of a head and shoulders formation triggers a sell signal. Similarly a break up from an inverse head and shoulders formation triggers a buy signal. We have studied price movements following such signals in the medium term in the Nordic markets.
Identification
Reliable identification of inverse/head and shoulders formations in stock prices is a difficult task. The figures above show that the price forms a left shoulder, a head and a right shoulder, before the neckline is broken. However, stock prices are rarely as regular as these illustrations. The shoulders will often be of different sizes, the head and one shoulder may be almost the same size, or the neckline may be crooked.
Many investors identify price formations by looking at price charts and drawing support and resistance lines by hand. This method has many weaknesses, most of all that it is subjective, allowing you to see the formations you [em]want to see[/], and it is very time consuming. Therefore we need an automatic algorithm whereby computers identify the formations and the signals they trigger.
Investtech has studied technical and quantitative analysis since 1997. We have developed mathematical algorithms for automatic identification of inverse/head and shoulders formations in stock prices. The formations are entered into the technical analysis charts, shown in signal lists and presented updated daily to Investtech’s subscribers.
Below are examples of such formations identified in Investtech’s price charts.
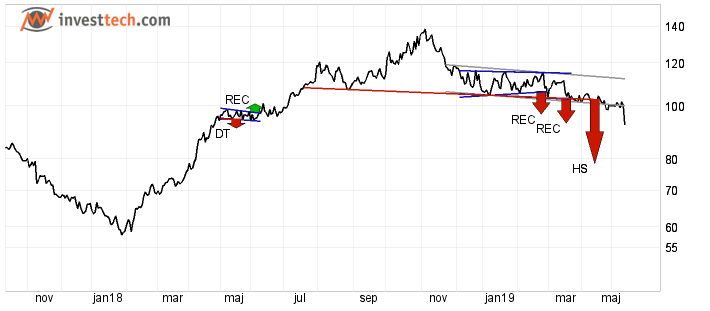
Figure 2a: Investtech's price chart for Norwegian stock Austevoll in the spring of 2019. The algorithms have identified a large head and shoulders formation, shown by code HS. The price fell a little the first few weeks after the signal, but then fell steeply as the company presented the Q1 financial report.
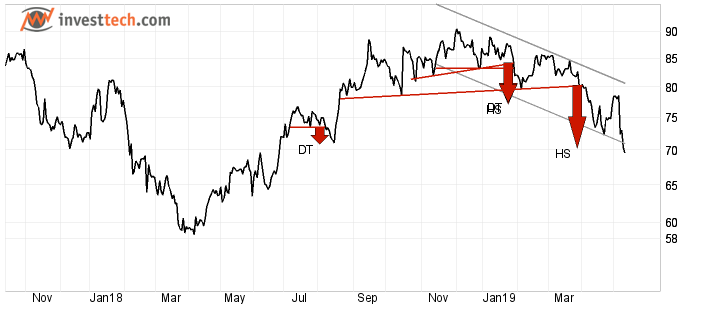
Figure 2b: Investtech's price chart for Swedish stock Ambea in the spring of 2019. The algorithms have identified sell signals from a small head and shoulders formation in January 2019. This came at the same time as a sell signal from a double top formation. At the end of March, a sell signal from a new and bigger head and shoulders formation was triggered. All these formations signalled the start of a falling trend.
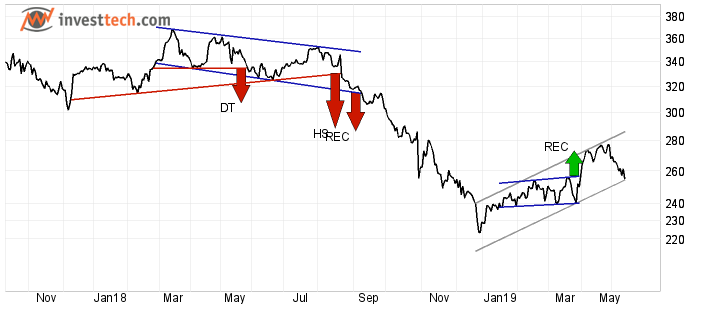
Figure 2c: Investtech's price chart for Danish stock Jyske bank in the spring of 2019. The algorithms have identified several price formations with sell signals in the summer of 2018, first a double top (DT), then a head and shoulders (HS) and finally a rectangle formation (REC).
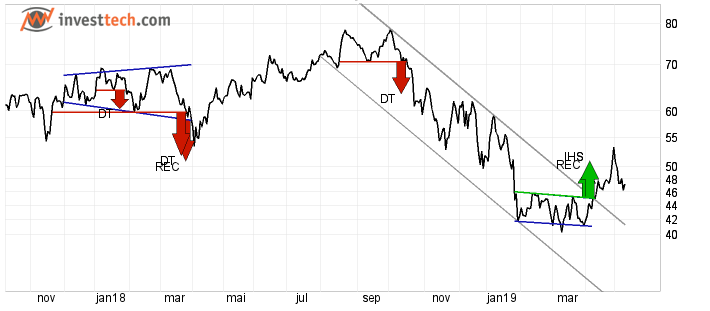
Figure 2d: Investtech's price chart for Norwegian stock Golden Ocean in the spring of 2019. The algorithms have identified a buy signal from an inverse head and shoulders formation, shown by IHS in the chart, in early April 2019. The green arrows give theoretical price target. The algorithms have also identified a rectangle formation (REC), which triggered a buy signal at the same time as the last inverse head and shoulders formation. Earlier in the chart there are several other formations, invluding a double top formation with sell signal in August 2018.
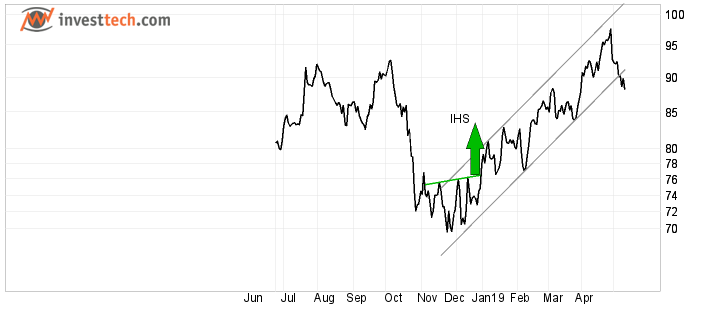
Figure 2e: Investtech's price chart for Swedish stock Epiroc in the spring of 2019. The algorithms identified an inverse head and shoulders formation, shown by code IHS, around the end of the year. It signalled the start of a rising trend.
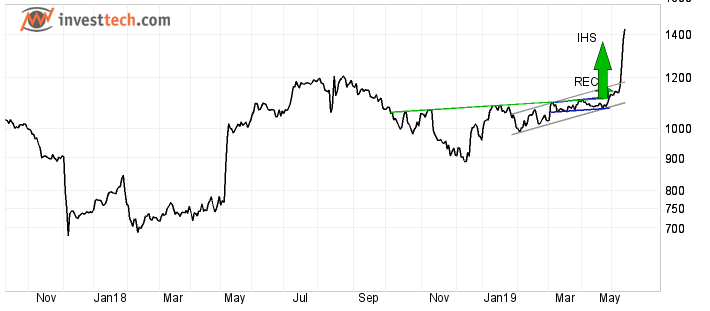
Figure 2f: Investtech's price chart for Danish stock ALK-Abello in the spring of 2019. The algorithms have identified an inverse head and shoulders formation which triggered a buy signal in late April.
The Base Data
We have studied stocks on the Nordic markets Norway, Sweden, Denmark and Finland. Investtech began by analysing Norwegian stocks and gradually expanded into more markets. For Norway we have data from 1996, for Sweden from 2003, Denmark from 2005 and Finland from 2007. For all countries we looked at data until 31. December 2018. We have identified signals until 27 September 2018, in order to study price development for 66 days (3 months) after the last signal.
All stocks that have been listed in the period are included. Stocks that have been delisted due to for instance mergers, takeovers and bankruptcy are included. All prices are adjusted for splits, dividend payments, reverse splits, and other corporate capital changes. Minor dividends in foreign currencies are generally not registered, with the exception of dollar dividends on the Oslo Stock Exchange.
The price used is the stock’s daily closing price. We have used price and volume numbers only from the stock’s primary market. Trading in other markets, like Chi-X, Bats and Burgundy, is excluded.
Standard dividend adjusted benchmark indices are used, respectively:
- Hovedindeksen (OSEBX) for Norwegian stocks
- OMX Stockholm Benchmark GI (OMXSBGI) for Swedish stocks
- OMX Copenhagen 25 GI (OMXC25GI) for Danish stocks
- OMX Helsinki GI (OMXHGI) for Finnish stocks
Data set
We have used Investtech’s algorithms for automatic identification of inverse/head and shoulders formations. For short term analyses, the algorithms were run on charts made up of 96 price days, approximately 20 calendar weeks. For medium term analyses, the algorithms were run on charts made up of 395 price days, approximately 18 calendar months, and for long term analyses we used long term Investtech charts with approximately 6 years of data. We consider the algorithms good at identifying actual inverse/head and shoulders formations, and they do not classify indistinct inverse/head and shoulders as actual formations.
At identification of signals, only data up to the date the signal was triggered were used. The later data were hidden from the algorithm.
Basically all signals identified from inverse/head and shoulders formations are used. Normally each formation only triggers one signal. However, in rare cases they may trigger several signals. This happens if the price following the break reacts back into the formation, creates a modified formation and then breaks out again.
Sometimes one stock can also trigger several signals on the same day. This happens if the algorithms have recognized several formations of different length and height which are broken out from at the same time.
To achieve a data set as representative for investors on the Nordic Stock Exchanges as possible, we remove certain signals from the data set:
- Duplicate signals are removed. This will be the case when there have been mergers and ticker changes, where Investtech has two editions of the same historical time series. For instance, we remove a buy signal from DNB if we already have it for DNBNOR.
- Signals that are very close in time to a previous signal are removed. For short term analyses, it is a requirement that there have been at least seven calendar days since the previous signal from the same stock in order for a new signal to be counted. For medium term analyses 14 days are required, and 31 days for long term analyses.
- Formations that are less than 2 % in height are discarded. These are small and considered to have low signal value.
- Signals from stocks with poor liquidity are discarded. This is because it is difficult for investors to make actual trades in such stocks, and also because the price is often uneven and with big leaps, making pricing uncertain and subject to noise. Minimum liquidity requirement was 500,000 NOK daily average turnover in the past 22 days. For Finland we used 50,000 Euro. This also removed signals from most exchange indices, leaving us with signals from stocks and equity certificates only, and a few traded funds. The actual turnover of stocks that gave signals may have been above this limit, as trade in other markets than the main Exchange, like Chi-X, Bats and Burgundy, are not included.
- Signals with less than 66 days' price history following the signals are removed. This gives complete price history for the first 66 days following the signals.
With the list above, we removed doubles and almost-doubles. However, there will still be signals that are quite similar to each other, since some stocks’ prices follow each other closely. Especially when the Exchange has fallen or risen a lot in a short time, many stocks may trigger signals at the same time. The signals (samples) are consequently not independent, and statistical measures for uncertainty (standard deviation and t-values) must be used with caution.
Our data set now consists of the following number of signals:
| Number | Norway | Sweden | Denmark | Finland | Total |
| Buy signal | 440 | 689 | 138 | 176 | 1,443 |
| Sell signal | 516 | 918 | 196 | 200 | 1,830 |
| Total number | 956 | 1,607 | 334 | 376 | 3,273 |
| Share of total | 29 % | 49 % | 10 % | 11 % | 100 % |
Results: Buy signals
The charts below show average price development following buy signals from inverse head and shoulders formations identified in Investtech’s medium term price charts. The signals are triggered on day 0 and we have studied price development until day 66. Only days when the exchange is open are included, so 66 days equal approximately three months. The thick blue line shows development of stocks with buy signals. The shaded areas are the standard deviation of the calculations. The thin blue line shows benchmark development in the same period as the buy signal stocks.
First is a large chart for the Oslo Stock Exchange. Below four smaller charts, one for each of the Nordic markets; Norway, Sweden, Denmark and Finland. Last a large chart with the combined results for all the Nordic markets. Click the images for bigger version.
Buy signal4.2 %5.1 %4.6 %1.1 %4.3 %
| Return and relative return after 66 days | Norway | Sweden | Denmark | Finland | Weighted average |
| Benchmark in same period | 3.1 % | 3.4 % | 3.1 % | 1.2 % | 3.0 % |
| Excess return buy signal | 1.0 pp | 1.6 pp | 1.5 pp | -0.0 pp | 1.2 pp |
| Annualised return (based on 66-day figures) | Norway | Sweden | Denmark | Finland | Weighted average |
| Buy signal | 16.8 % | 20.8 % | 18.6 % | 4.4 % | 17.3 % |
| Benchmark in same period | 12.4 % | 13.7 % | 12.5 % | 4.6 % | 12.1 % |
| Excess return buy signal | 4.4 pp | 7.1 pp | 6.2 pp | -0.2 pp | 5.2 pp |
| Return and t-value, weighted average, the Nordic markets | Day 1 | Day 10 | Day 22 | Day 66 |
| Buy signal | 0.4 % | 1.3 % | 2.4 % | 4.3 % |
| Benchmark in same period | 0.1 % | 0.5 % | 1.4 % | 3.0 % |
| Excess return buy signal | 0.3 pp | 0.8 pp | 1.0 pp | 1.2 pp |
| T-value vs benchmark in same period | 3.6 | 3.2 | 2.7 | 1.9 |
pp = percentage points, i.e. the arithmetic difference of the percentage returns. Annualised figures are calcuated by repeating the 66-day figures for one year, assuming an average year has 252 stock exchange days.
Buy signals from inverse head and shoulders formations identified in Investtech’s medium term price charts have historically given a good price increase the following 66 days. The highest rise was in Sweden, by 5.1 per cent, equal to an excess return of 1.6 percentage points vs benchmark. Signals in Norway and Sweden were also followed by a good price rise, better than benchmark, while Finnish stocks developed in line with benchmark.
The charts for the four countries are a little different, and the shaded areas, which are the standard deviation and visualize uncertainty, are large. None of the markets are considered to give significant results individually.
For the Nordic markets combined, however, the chart is nice and even. The rise is especially strong in the first few weeks after the signal, both in absolute and relative figures. After 66 days the average rise was 4.3 per cent, equal to 1.2 percentage points better than benchmark. Annualised excess return was 5.2 percentage points.
T-value after 22 days is 2.7, while it is 1.9 after 66 days. This is too low to say that the results are statistically significant, as the samples are not entirely independent. However, the results still imply that it is likely that stocks with buy signals from medium term inverse head and shoulders formations will give positive return and excess return in the following three months, but the data set is not big enough to say this with a high degree of certainty.
After 22 days, return for signal stocks is 2.4 per cent, equal to 1.0 percentage points better than benchmark. This gives an annualised excess return of 13.7 percentage points.
Results: Sell signals
The charts below show average price development following sell signals from head and shoulders formations identified in Investtech’s medium term price charts. The signals are triggered on day 0 and we have studied price development until day 66. Only days when the exchange is open are included, so 66 days equal approximately three months. The thick red line shows development of stocks with sell signals. The shaded areas are the standard deviation of the calculations. The thin red line shows benchmark development in the same period as the sell signal stocks.
First is a large chart for the Oslo Stock Exchange. Below four smaller charts, one for each of the Nordic markets; Norway, Sweden, Denmark and Finland. Last a large chart with the combined results for all the Nordic markets. Click the images for bigger version.
Sell signal0.9 %2.9 %3.3 %0.9 %2.1 %
| Return and relative return after 66 days | Norway | Sweden | Denmark | Finland | Weighted average |
| Benchmark in same period | 2.3 % | 2.6 % | 2.3 % | 2.5 % | 2.5 % |
| Excess return sell signal | -1.4 pp | 0.3 pp | 1.0 pp | -1.6 pp | -0.3 pp |
| Annualised return (based on 66-day figures) | Norway | Sweden | Denmark | Finland | Weighted average |
| Sell signal | 3.5 % | 11.4 % | 13.2 % | 3.4 % | 8.4 % |
| Benchmark in same period | 9.2 % | 10.2 % | 8.9 % | 9.9 % | 9.7 % |
| Excess return sell signal | -5.7 pp | 1.2 pp | 4.2 pp | -6.5 pp | -1.3 pp |
| Return and t-value, weighted average, the Nordic markets | Day 1 | Day 10 | Day 22 | Day 66 |
| Sell signal | 0.0 % | 0.1 % | 0.1 % | 2.1 % |
| Benchmark in same period | 0.1 % | 0.6 % | 0.9 % | 2.5 % |
| Excess return sell signal | -0.1 pp | -0.5 pp | -0.8 pp | -0.3 pp |
| T-value vs benchmark in same period | -1.1 | -2.8 | -3.1 | -0.6 |
The data sets are relatively small per market, which causes great statistical uncertainty. The results diverge a little between markets and none of them have statistically significant results. Consequently we look at the combined Nordic market results, but there is great statistical uncertainty here as well, visualised by the red shaded area in the charts.
The average figures for the Nordic markets show a rise of 2.1 per cent in the first 66 days following sell signals. With a t-value of 0.6, this is not significantly different from benchmark, which rose 2.5 per cent.
Results are stronger for the first 10 and 22 days following signal. On average stocks with sell signals then underperformed by 0.5 and 0.8 percentage points respectively, giving t-values of 2.8 and 3.1.
Sell signals from medium term head and shoulders formations in Nordic stocks have thus shown good predictive power in the 10 and 22 day perspectives, but do not appear to have any predictive power beoynd this. After 22 days, return for signal stocks is 0.1 per cent, 0.8 percentage points less than benchmark. This gives an annualised negative excess return of 9.8 percentage points.
Results: Buy and sell signals combined
The charts below show average price development following buy and sell signals from inverse/head and shoulders formations identified in Investtech’s medium term price charts vs average benchmark for the whole period. This is different from the charts and figures above, where we compared the development of benchmark in the same time period as the development of the signal stocks.
Buy signals are the blue line and sell signals are the red line. The shaded areas indicate the standard deviation of the calculations. Benchmark is the black line.
| Average return after 66 days | Norway | Sweden | Denmark | Finland | Weighted average |
| Buy signal | 4.2 % | 5.1 % | 4.6 % | 1.1 % | 4.3 % |
| Sell signal | 0.9 % | 2.9 % | 3.3 % | 0.9 % | 2.1 % |
| Benchmark | 3.0 % | 3.5 % | 2.5 % | 1.2 % | 3.0 % |
| Excess return buy signal | 1.1 pp | 1.5 pp | 2.0 pp | -0.0 pp | 1.2 pp |
| Excess return buy signal | -2.1 pp | -0.7 pp | 0.7 pp | -0.3 pp | -0.9 pp |
| Annualised return (based on 66-day figures) | Norway | Sweden | Denmark | Finland | Weighted average |
| Buy signal | 16.8 % | 20.8 % | 18.6 % | 4.4 % | 17.3 % |
| Sell signal | 3.5 % | 11.4 % | 13.2 % | 3.4 % | 8.4 % |
| Benchmark | 12.2 % | 14.2 % | 10.1 % | 4.5 % | 12.1 % |
| Excess return buy signal | 4.7 pp | 6.6 pp | 8.6 pp | -0.0 pp | 5.3 pp |
| Excess return sell signal | -8.7 pp | -2.8 pp | 3.1 pp | -1.0 pp | -3.6 pp |
| Return and t-value, weighted average, the Nordic markets | Day 1 | Day 10 | Day 22 | Day 66 |
| Buy signal | 0.4 % | 1.3 % | 2.4 % | 4.3 % |
| Benchmark average | 0.0 % | 0.5 % | 1.0 % | 3.0 % |
| Excess return buy signal | 0.3 pp | 0.8 pp | 1.4 pp | 1.2 pp |
| T-value vs average benchmark | 3.6 | 3.4 | 3.8 | 1.9 |
| Return and t-value, weighted average, the Nordic markets | Day 1 | Day 10 | Day 22 | Day 66 |
| Sell signal | 0.0 % | 0.1 % | 0.1 % | 2.1 % |
| Benchmark average | 0.0 % | 0.5 % | 1.0 % | 3.0 % |
| Excess return sell signal | -0.0 pp | -0.4 pp | -0.9 pp | -0.9 pp |
| T-value vs average benchmark | -0.6 | -2.1 | -3.3 | -1.7 |
The analysis above is a good way to reveal any method errors or data errors in the analysis. For instance, buy signals could show very strong results, but if sell signals showed a similar development, so that the charts overlap, the data must be looked at in more detail. It could be because excess return was due to systematically higher risk in signal stocks, systematic data errors in the base data or a data set that was too small, and also simple calculation errors.
However, the charts above show a great deal of divergence between the buy and sell signal stocks. The first month, until approximately day 22, buy signal stocks have risen compared to benchmark, and sell signal stocks have fallen. Beyond that, the stocks have developed in line with average benchmark.
The results are a little different between each Nordic market, and largely due to small data sets there is low statistical significance. For the Nordic markets combined, though, this analysis strengthens the earlier analyses, concluding that stocks with inverse/head and shoulders formations give good indications about price development in the first four to five weeks, but have little signal power beyond this.
Explanatory model - Why do stocks with sell signals continue to rise?
Figure 6: Price development following buy signals from inverse head and shoulders formations and sell signals from head and shuolders formation in the Nordic markets. The chart includes price development from ten days before signals are triggered until 66 days after.
s
The figure above shows the same as the return chart in figure 5, except that this one also includes price development for ten days [em]before[/em] the signals are triggered. This chart shows the interesting fact that stocks with buy signals have risen a lot prior to the signal, while stocks with sell signals have fallen a lot.
The chart shows that stocks with buy signals from inverse head and shoulders formations on average have risen around 7 per cent the last ten days up to and including the day the signal was triggered. It may be psychologically difficult to buy a stock that has risen so much so quickly. This may be why the signals work so well. The stock should actually rise more, based on news or fundamental factors that may have triggered the signal, but it does not due to investor psychology and human weakness. Over time investors accept the reason for the price increase and become more positive, giving a fine rise and good excess return vs benchmark in the following months.
The same is true for sell signals. The chart shows that stocks with sell signals from head and shoulders formations on average fell by some 6 per cent in the ten days up to and including the day the signal was triggered. And they still continue to underperform relative to index in the following weeks and months. It can be psychologically difficult to sell a stock which has become so much “cheaper” in such a short time. It takes time before the actual conditions are understood, fundamental analyses are adjusted, and investors overcome their own psychological resistance to selling at lower prices. Thus the stock’s development is weaker than that of the index also in the period after the price fall which triggered the sell signal.
Robustness over time
The starting point for technical stock analysis is that price movements are largely controlled by human decisions and that these are to some extent influenced by the human psyche. We believe that the total mass of investors in the stock market behaves roughly the same from year to year, and from decade to decade, since human nature and psyche change little over time.
However, other conditions can change over time, such as how technology works. Knowledge of financial relationships and apparent anomalies in the market, and how they spread to investors, is another example of something that can change over time.
An analysis of return figures over time could indicate the degree to which the target of a type of signal is consistently met. In order to have a robust indicator that can form the basis for future investment decisions, we want excess return to be significant and to persist over time.
We have done two types of analyses to illustrate this. First, we have run the same analyses as shown above, for the last five-year period. This will allow us to see if there have been any significant changes, for example due to new technology, in the recent period. We then looked at average return over periods of five years, in order to more easily see if there is a trend in how much the signals yield.
The stock market is by nature very stochastic, and there will be major natural changes from year to year and between five-year periods. To be able to compare as fairly as possible, we look at relative figures.
Figure 7e: Buy and sell signals vs average benchmark, the Nordic markets, the whole period, 1996-2018.
Figure 7f: Buy and sell signals vs average benchmark, the Nordic markets, the past five years, 2014-2018.
Figure 7 shows return following signals. Results for the whole period on the left and five-year results 2014 to 2018 on the right.
| The Nordic markets, annualised | Whole period (1996-2018) | Past five years (2014-2018) |
| Buy signal | 5.2 pp | 15.9 pp |
| Sell signal | -1.3 pp | -3.2 pp |
The table shows annualised excess return in percentage points, abbreviated pp, vs benchmark in the same period, based on 66-day return figures.
The table and charts show that signals from head and shoulders formations in Investtech's medium term pric charts have performed better in the past five years than in the whole time period studied. Stocks with buy signals from inverse head and shoulders formations have an annualised excess return of 15.9 percentage points in the past five years, compared to 5.2 percentage points for the whole period. The chart in figure 7b shows even development and increasing excess return in the first three months after signals, and the area of uncertainty (standard deviation) suggests good significance.
Sell signals from head and shoulders formations show similar development in the past years and the whole period, with small, non-significant negative excess return.
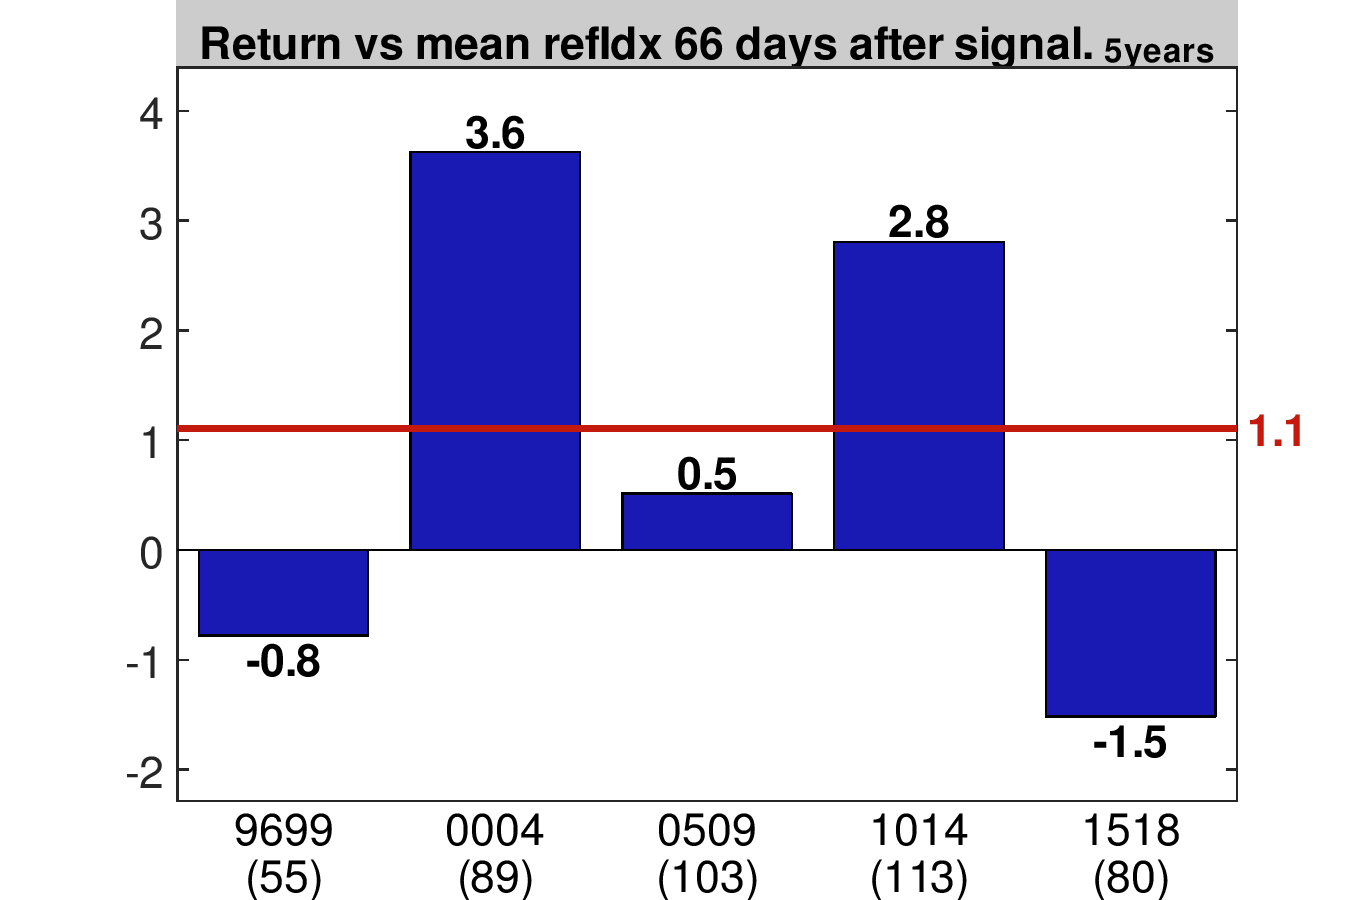
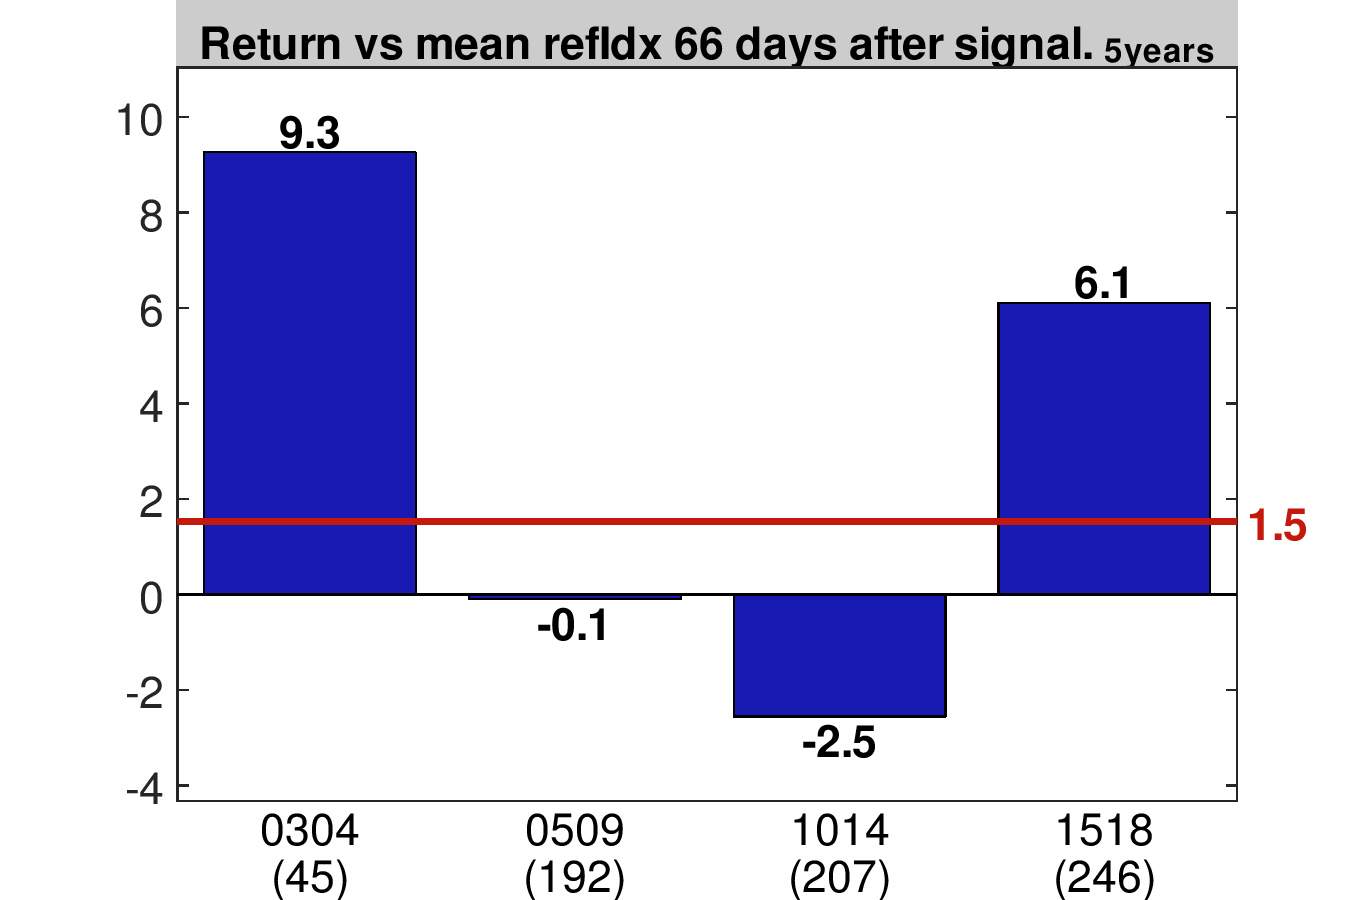
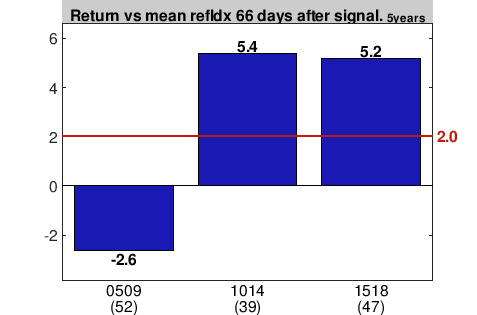
Figure 8: The histograms above show return 66 days after buy signals split into five-year intervals for each Nordic market. The first figure below each column states the first and last year shown in the column. Note that the periods vary by market depending on available history. The last period is the four years from 2015 to 2018. The figures in parentheses show number of signals in the period. Positive numbers, columns above zero, show that buy signals on average have risen more than benchmark in the same period.
The small data set is a challenge here. Splitting the data into five-year periods for each of the Nordic markets, gives data sets made up of fewer than 100 asmples in 10 out of 15 time periods. There is little point to statistical analysis of such a small number of samples. The results are incuded here for the sake of completion, but cannot be used to draw conclusions.
The importance of liquidity
In the calculations above we have included signals from stocks with an average daily turnover of at least half a million Norwegian krone or 50,000 Euro. Varying the liquidity parameters allows us to investigate if there is a difference in signal strength for smaller and bigger companies.
Drawing the line at five million krone splits the companies into two roughly similar groups.
Figure 9a: Norway smaller companies.
9a figures: Signals from companies with daily turnover between 0.5 and 5 million Norwegian krone.
9b figures: Signals from companies with daily turnover above 5 million krone.
| Relative return after 66 days | Norway | Sweden | Denmark | Finland | Weighted average |
| Excess return buy signal, smaller companies | -1.1 pp | 1.7 pp | 4.8 pp | 0.3 pp | 0.9 pp |
| Excess return buy signal, bigger companies | 3.5 pp | 1.6 pp | -1.3 pp | -0.3 pp | 1.6 pp |
| Relative return after 66 days | Norway | Sweden | Denmark | Finland | Weighted average |
| Excess return sell signal, smaller companies | -1.1 pp | 0.4 pp | 1.8 pp | -3.9 pp | -0.3 pp |
| Excess return sell signal, bigger companies | -1.7 pp | 0.2 pp | 0.5 pp | -0.0 pp | -0.3 pp |
As is the case in the above analysis of different time periods, the data sets are too small here as well. However, the results for the Nordic markets combined are built on medium size data sets of just under 1,000 samples each. These show very similar development for bigger and smaller companies. The differences are too small to conclude with any statistical significance, even though stocks with buy signals have done a little better for the bigger companies than the smaller ones.
Summary
Geometric price patterns, like inverse/head and shoulders formations, are used in technical analysis to predict future price development. Many investors use this as an important part of their decision making process when buying or selling stocks.
We have studied return from Norwegian, Swedish, Danish and Finnish stocks following buy and sell signals from inverse/head and shoulders formations identified in Investtech’s medium term price charts. We had 23 years of data, from 1996 to 2018. Investtech’s automatic algorithms identified a total of 1,443 buy signals and 1,830 sell signals.
Stocks with buy signals on average rose by 4.3 per cent in the first 66 days following signals, while stocks with sell signals rose 2.1 per cent. Compared to benchmark in the same period, stocks with buy signals did 1.2 percentage points better and stocks with sell signals did 0.3 percentage points worse. Annualised excess return was 5.2 percentage points for buy signals and -1.3 percentage points for sell signals.
The data sets are a little small and the difference in return vs benchmark is not convincing. T-values of 1.9 and 0.6, and not completely independent data, mean we cannot unambiguously say that signals from medium term inverse/head and shoulders formations give good predictive power in the 66-day perspective.
Results are stronger in the 22-day perspective, however. T-values are 2.7 and 3.1. Excess return for buy signal stocks was 1.0 percentage points and negative excess return for sell signal stocks was 0.8 percentage points. Annualised excess return was 13.7 and -9.8 percentage points for buy and sell signals respectively.
The data sets are too small to conclude with any difference in signal strength for smaller and bigger companies, or for different time periods. If anything we can only say that stocks with buy signals from inverse head and shoulders formations have done better in the past five years than in the whole period combined.
The time period for the study is fairly long, the quality of the data is considered to be good and the algorithms used are entirely automatic and deemed to identify only actual formations. And yet the data set is not very large, and it is difficult to make unambiguous conclusions.
With relatively good significance, however, it appears that signals from inverse/head and shoulders type formations in Investtech's medium term price charts give good signals in the four to five week perspective. Stocks with buy signals from medium term inverse head and shoulders formations have had good absolute return and excess return vs benchmark in the first 22 days. At the same time, stocks with sell signals from medium term head and shoulders formations have given clear negative excess return in the first 22 days.
Literature
- Investtech, Insight & Skills. Price formations. Link
- Investtech, Insight & Skills. Buy signal from inverse head and shoulders formation. Link
- Investtech, Insight & Skills. Sell signal from head and shoulders formation. Link
- Geir Linløkken. Buy signals from rectangle formations. Investtech.com, 2009. Link
- Geir Linløkken and Steffen Frölich. Technical Stock Analysis - for reduced risk and increased returns. Investtech.com, 2001.
- John J. Murphy. Technical Analysis of the Financial Markets. New York Institute of Finance, 1999.
Keywords: Buy signal,Denmark,Finland,h_PatHsSell,h_PatIhsBuy,help topic main report,Helsinki stock exchange,Nordic markets,Norway,Sell signal,Stock exchanges,Sweden,Technical analysis.
Kirjoittaja

Perustaja ja tutkimustyön johtaja
Investtech
Investtech ei takaa analyysien tarkkuutta tai kattavuutta. Kaikkien analyysien tuottamien neuvojen ja signaalien käyttäminen on täysin käyttäjän vastuulla. Investtech ei vastaa mistään tappioista, jotka saattavat syntyä Investtechin analyysien käytön seurauksena. Mahdollisten eturistiriitojen yksityiskohdat mainitaan aina sijoitusneuvon yhteydessä. Lisätietoja Investtechin analyyseistä löytyy täältä disclaimer.
Investtech ei takaa analyysien tarkkuutta tai kattavuutta. Kaikkien analyysien tuottamien neuvojen ja signaalien käyttäminen on täysin käyttäjän vastuulla. Investtech ei vastaa mistään tappioista, jotka saattavat syntyä Investtechin analyysien käytön seurauksena. Mahdollisten eturistiriitojen yksityiskohdat mainitaan aina sijoitusneuvon yhteydessä. Lisätietoja Investtechin analyyseistä löytyy täältä disclaimer.


 Oslo Børs
 Stockholmsbörsen
 Københavns Fondsbørs
 Helsingin pörssi
 World Indices
 US Stocks
 Toronto Stock Exchange
 London Stock Exchange
 Euronext Amsterdam
 Euronext Brussel
 DAX
DAX CAC 40
 Mumbai S.E.
 Commodities
 Currency
 Cryptocurrency
 Exchange Traded Funds
 Investtech Indices