Hausse index
The Hausse indices are indicators of optimism. They show the ratio of investors who are positive in the market.
An analysis of hausse indices is an important part of an overall market analysis. Hausse analysis can show the level of optimism among short term and long term investors, and whether the optimism is rising or falling. In special situations, following long rises or falls, hausse analysis can identify the turning points in the market.
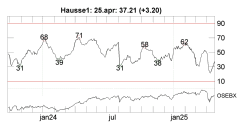
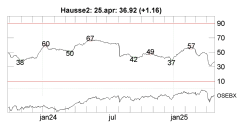
Investtech’s short term hausse index (hausse1) measures optimism among short term investors. The index is a good gauge for the level of activity in the market among investors who tend to keep a stock for one to six weeks. Investtech’s long term hausse index (hausse2) measures optimism among long term investors. It shows mood swings in the market among long term investors who tend to keep the same stock for several months or years.
When a long term reversal in the market is coming, it can often be detected early by watching the actions of short term investors. Therefore an analysis of the short term hausse index is important, not only for short term fluctuations, but also for long term trends and reversals.
The two Trading Range strategies give a buy signal when the price of a stock moves above a previous top and a sell signal when the price moves below a previous bottom, in the short/medium term. Signals from price patterns and trends are considered to be significantly stronger than Trading Range signals, but Trading Range signals can in some cases be triggered sooner.
The Hausse index shows ratio of companies that have triggered buy signals
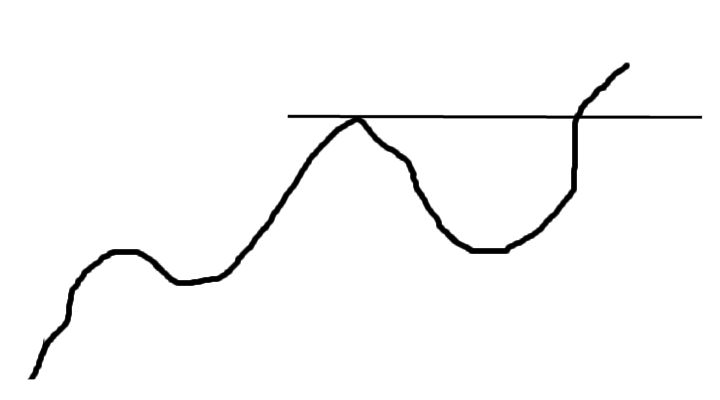 We can measure optimism in a stock by seeing if investors are still willing to pay more than before for the stock. If this is the case, i.e. that the stock has risen above the previous top, the stock is given a buy signal in the hausse estimate.
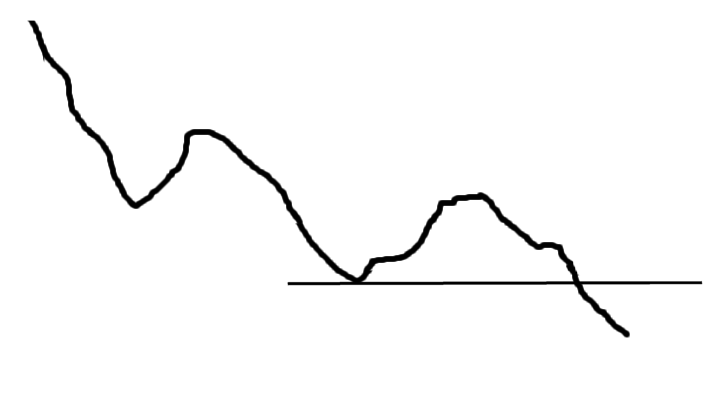 If the opposite is true, i.e. investors are willing to sell at lower prices, lower than previous bottoms, the stock is given a sell signal in the hausse estimate.
The Hausse index shows the ratio between number of companies that have triggered buy signals and total number of companies. The index has a value between 0 and 100, where 0 means that every company’s last signal was a sell signal, and 100 means that every company’s last signal was a buy signal. Values above 50 indicate that a majority of investors are positive.
Normal situation
Positive Hausse index:
- Rising Hausse values, after a notable bottom (increasing optimism)
- Value above 50 (high optimism)
- Rising tops and bottoms (long term improvement of optimism, but short term uncertainty)
- Strengthens or confirms a positive analysis of the market index
Negative Hausse index:
- Falling Hausse values, after a notable top (decreasing optimism)
- Values under 50 (low optimism)
- Falling tops and bottoms (long term reduction of optimism, but short term uncertainty)
- Strengthens or confirms a negative analyis of the market index
Important special situations
Elation:
- Very high Hausse value, 90 or above
- Almost everyone is positive, and consequently almost everything is positively priced in the stock market
- Almost any change will be negative
- Signals overheating of the market and that a major reaction/reversal is due soon
- Consider selling when the Hausse value drops below 90 again (falling optimism, emerging pessimism)
Dejection:
- Very low Hausse value, 10 or less
- Almost everyone is negative, and consequently almost everything is negatively priced in the stock market
- Almost any change will be positive
- Signals that a wide sales pressure will soon be over and that prices will start rising again
- Consider buying when the Hausse value climbs above 10 again (emerging optimism)
Investtech ei takaa analyysien tarkkuutta tai kattavuutta. Kaikkien analyysien tuottamien neuvojen ja signaalien käyttäminen on täysin käyttäjän vastuulla. Investtech ei vastaa mistään tappioista, jotka saattavat syntyä Investtechin analyysien käytön seurauksena. Mahdollisten eturistiriitojen yksityiskohdat mainitaan aina sijoitusneuvon yhteydessä. Lisätietoja Investtechin analyyseistä löytyy täältä disclaimer.
Investtech ei takaa analyysien tarkkuutta tai kattavuutta. Kaikkien analyysien tuottamien neuvojen ja signaalien käyttäminen on täysin käyttäjän vastuulla. Investtech ei vastaa mistään tappioista, jotka saattavat syntyä Investtechin analyysien käytön seurauksena. Mahdollisten eturistiriitojen yksityiskohdat mainitaan aina sijoitusneuvon yhteydessä. Lisätietoja Investtechin analyyseistä löytyy täältä disclaimer.


 Oslo Børs
 Stockholmsbörsen
 Københavns Fondsbørs
 Helsingin pörssi
 World Indices
 US Stocks
 Toronto Stock Exchange
 London Stock Exchange
 Euronext Amsterdam
 Euronext Brussel
 DAX
DAX CAC 40
 Mumbai S.E.
 Commodities
 Currency
 Cryptocurrency
 Exchange Traded Funds
 Investtech Indices