
 Oslo Børs
 Stockholmsbörsen
 Københavns Fondsbørs
Investeringsforeninger
Københavns Fondsbørs
Investeringsforeninger
 Helsingin pörssi
 World Indices
 US Stocks
US 30
Nasdaq 100
US 500
US Stocks
US 30
Nasdaq 100
US 500
 Toronto Stock Exchange
 London Stock Exchange
 Euronext Amsterdam
 Euronext Brussel
 DAX
SDAX
TECDAX
Frankfurt
CDAX
MDAX
Prime Standard
DAX
SDAX
TECDAX
Frankfurt
CDAX
MDAX
Prime Standard
 CAC 40
 Mumbai S.E.
National S.E.
Mumbai S.E.
National S.E.
 Commodities
 Currency
 Cryptocurrency
 Exchange Traded Funds
 Investtech Indices
High and Low Volume Balance Preliminary Research Results
Ongoing research at Investtech, 22 June 2015
Published in English on 25 June 2015. Norwegian original here >>
What does high or low volume balance mean for future price development? Does it signal rising or falling prices? We have looked at price development following volbal22 reaching extreme levels on the stock exchanges in Norway, Sweden, Denmark and Finland.
Volume Balance Investtechs indicator for buyer and seller aggression
Investtech developed the indicator Volume Balance in order to measure the aggression of the sellers and buyers of a stock. The aim was to create an indicator that could predict whether a stock would rise or fall. The idea was that if the price and volume patterns in a stock can be explained by aggressive buyers and passive sellers, it indicates that the price will rise. Similarly, a pattern that can be explained by aggressive sellers and passive buyers will predict falling prices.
The following is from Investtechs Volume Balance help pages:
Volume balance measures how aggressive the investors are on rising and falling prices. It can give the following answers:
- Investors are now so aggressive that they push the price upwards to buy into the stock.
- Investors are now so pessimistic that they push the price downwards to get rid of their stocks.
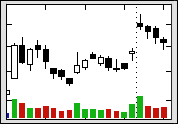
 High volume on increasing prices indicates that optimism is increasing and many investors pay more to secure stocks. Low volume on falling prices indicates that few investors will reduce the price to secure a sell and that they are comfortable keeping the stock. This is positive, and mirrored in a high volume balance.
The green columns show volume on days with increasing prices, while the red show volume on days with falling prices. High green columns and low red ones give positive volume balance.
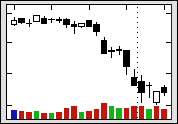
 High volume on falling prices indicates increasing uncertainty and that many investors reduce the price to get rid of their stocks. Low volume on rising prices indicates that few investors are willing to pay more to be able to buy, and they are not very interested or assume they can buy at a lower price later. This is negative, and mirrored in a low volume balance.
Please note the high red volume columns in the chart to the left, combined with the low green ones. We see this already in the first half of the chart. Volume balance was negative and signalled the coming price decrease.
Positive volume balance strengthens buy signals from other indicators, while negative volume balance strengthens sell signals. Likewise, positive volume balance will strengthen or confirm a rising trend, whereas negative volume balance will confirm a falling trend. As shown above, volume balance also often warns of coming price movements.
In Investtechs charts, volume balance is shown as three arrows in the bottom right hand corner of the charts. The first arrow is calculated based on the trading in the past week, the second for the past month and the third one for the past quarter. Especially the weekly indicator is susceptible to noise and should be used with care. At the same time, it can be the best indicator when looking for very short term investment opportunities.
Calculating volume balance
Volume balance is basically the correlation between price change and volume. The indicator is calculated for 5, 22 and 66 days, corresponding to a week, a month and a quarter respectively.
The indicator has values between 100 for maximally negative and +100 for maximally positive. The exact values are shown in the table in the chart pages, and visualized by arrows in the bottom right hand corner of the charts. Green arrows pointing upwards show that volume balance is positive and red arrows pointing downwards show that volume balance is negative. Yellow sideways arrows show neutral volume balance.
Research into Volume Balance preliminary results
Investtech has started a research project into whether volume balance can predict future price development. The project is part of a bigger signal analysis project and is supported by the Research Council of Norway.
We have studied the stocks in the Nordic markets Norway, Sweden, Denmark and Finland. For Norway we have high quality data from 1996 to 2014, see data description here.
For Sweden we have high quality data from 2003 to 2014, see data description here.
For Denmark and Finland we have data from 2003 to 2014. As is the case for Norway and Sweden, all stocks listed in the period are included, and prices are adjusted for dividend, splits and other corporate actions. However, as we do not have the same daily monitoring, manual checks and data corrections for these markets as for Norway and Sweden, the data quality is not as high.
Volume Balance 22 reaching critical levels
The values for volume balance for 5, 22 and 66 days are shown in the table at the bottom of Investtechs analysis pages for each stock. In the bottom right hand corner of the analysis chart, volume balance is shown in three arrows, one for each of the time periods. We have analysed the middle one, 22 days, i.e. the middle arrow.
We have used -40 and 40 as our critical levels. When the volume balance falls below -40, the 22-day arrow turns red and points downwards. When it rises above 40, the arrow turns green and points upwards. The transition between direction and colour of the arrows is gradual, for values between 0 and 60, but we have used 40 as the limit for the purposes of this study.
When volume balance fell below -40, a sell signal was defined, based on the idea that this indicates aggressive sellers. When volume balance rose above 40, a buy signal was defined.
| Number | Norway | Sweden | Denmark | Finland | Total |
| Buy signal volbal22 goes above 40 | 8,843 | 10,535 | 3,733 | 1,469 | 24,580 |
| Sell signal volbal22 falls below -40 | 2,908 | 5,537 | 1,689 | 1,169 | 11,303 |
The table shows the number of buy and sell signals from a strategy based on volbal22. Investtechs computers identified a total of 24,580 cases where volbal22 went above 40. This is a buy signal. Investtechs computers also identified 11,303 cases where volbal22 fell below -40, which is a sell signal.
The signals were identified by analysing all cases where volbal22 crossed the critical limits. Only signals where it was more than 14 days since the previous signal in the same stock were counted. This to avoid near-doubles. Yet a big number of signals will be quite similar, because quite a few stocks follow each other closely in terms of prices. Especially when the exchange has risen or fallen a lot in a short time, many stocks will trigger signals at the same time. The signals (samples) will therefore not be independent, and statistical measures for uncertainty (standard deviation) cannot be used indiscriminately.
Volbal22 Norway.
Volbal22 Sweden.
Volbal22 Denmark.

Volbal22 Finland.
Figure 3: Price development following buy and sell signals from 22-day volume balance identified by Investtechs computers. Click the charts for bigger versions.
The charts show average price development following buy and sell signals from 22-day volume balance. The signals are triggered on day 0. Only days when the exchange is open are included, so 66 days equal approximately three months. Buy signals are the blue line and sell signals are the red one. The shaded areas are the standard deviation of the calculations. Benchmark index is the black line.
| Average return after 66 days | Norway | Sweden | Denmark | Finland | Weighted average |
| Buy signal volbal22 goes above 40 | 4.9 % | 4.7 % | 4.7 % | 3.9 % | 4.7 % |
| Sell signal volbal22 falls below -40 | 0.9 % | 1.9 % | 1.9 % | 3.0 % | 1.8 % |
| Benchmark | 3.2 % | 4.0 % | 3.6 % | 1.5 % | 3.5 % |
The results in the four markets are quite consistent. Stocks with buy signals continue to rise, and they rise more than the average benchmark development. Stocks with sell signals from volume balance have also risen, but, except for Finland, they have risen significantly less than average benchmark index development.
Figure 4: Price development after Volume Balance 22 signals for Norway. Same as figure 3, but including price development in the days before the signal is triggered.
Sensitivity analysis
We have conducted a sensitivity analysis for the Norwegian market for volume balance period (for example 15, 22, 30 days), trigger value (for example signal triggered at volume balance crossing 20, 40, 60) and how the signals are identified (signal at break to extreme levels or when volume balance returns from extreme levels).
The combined results show that the volume balance indicator is robust, in terms of both period parameter, trigger value and signal identification.
Summary and conclusion
We have studied 24,580 cases where Volume Balance 22 crossed the 40 limit and 11,303 cases where it fell below the -40 limit. We have used 19 years of stock prices from Norway and 12 years from the other countries. The data are made up of about 30 % from Norway, 45 % from Sweden, 15 % from Denmark and 10 % from Finland.
The buy signal results are consistent in all four markets and show that stocks where volume balance is clearly positive, above the critical 40 level, on average continue to rise. At the same time, stocks in Norway, Sweden and Denmark with low volume balance, below the critical -40 level, continue to underperform compared to benchmark. In Finland, where we have relatively few data and the benchmark index has developed weakly, sell signals have done better than average benchmark development.
The results indicate that Investtechs Volume Balance indicator is well suited to catching positive and negative changes in investor behaviour. Volume balance can be used to identify good buy candidates (stock picking). It is likely that statistical return better than average benchmark return can be achieved by following signals from Investtechs volume balance indicator.
Volume balance is also seen as a good indicator to strengthen or weaken other signals from Investtechs analyses. For example, buy signals from rising trend can be strengthened by positive volume balance, and weakened by negative volume balance.
Work in progress
Quite a bit of work remains before a complete research report on this can be presented. The data set must be verified. We want to check the extent to which extreme price development in single stocks impact the average results. We want to see if there is a difference in volume balance for smaller and bigger companies. It may also be of interest to look into how volume balance works combined with other indicators, like support/resistance, RSI and trend.
Keywords: Buy signal,Copenhagen,Helsinki,Oslo,Sell signal,statistics,Stockholm,Volbal,Volume Balance.
Kirjoittaja

Perustaja ja tutkimustyön johtaja
Investtech
"Investtech analysoi markkinoiden psykologiaa ja antaa konkreettisia kaupankäyntisuosituksia päivittäin."

Partner & Senior Advisor - Investtech


Investtech ei takaa analyysien tarkkuutta tai kattavuutta. Kaikkien analyysien tuottamien neuvojen ja signaalien käyttäminen on täysin käyttäjän vastuulla. Investtech ei vastaa mistään tappioista, jotka saattavat syntyä Investtechin analyysien käytön seurauksena. Mahdollisten eturistiriitojen yksityiskohdat mainitaan aina sijoitusneuvon yhteydessä. Lisätietoja Investtechin analyyseistä löytyy täältä disclaimer.
Investtech ei takaa analyysien tarkkuutta tai kattavuutta. Kaikkien analyysien tuottamien neuvojen ja signaalien käyttäminen on täysin käyttäjän vastuulla. Investtech ei vastaa mistään tappioista, jotka saattavat syntyä Investtechin analyysien käytön seurauksena. Mahdollisten eturistiriitojen yksityiskohdat mainitaan aina sijoitusneuvon yhteydessä. Lisätietoja Investtechin analyyseistä löytyy täältä disclaimer.
Päätoimisto
Strandveien 171366 Lysaker, Norway
Tutkimusosasto
Instituttveien 102007 Kjeller, Norway