The Trend Bible
 Puhelin: 08-517 29 555
 Sähköposti
 Yhteydenottopyyntö
 Vierailukäynti
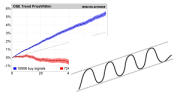
Stocks in rising trends have on average seen a clearly positive price development over the next 66 days and a price development significantly better than average benchmark development.
Research Results – Stocks in Rising and Falling Trends in the Medium Long Term
We have studied how stocks that were in a rising or falling trend at one time have developed over the next three months. Stocks in rising trends were assigned buy signals and stocks in falling trends were assigned sell signals.
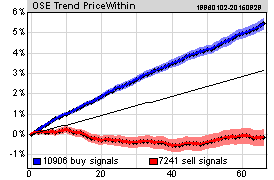
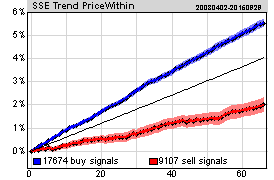
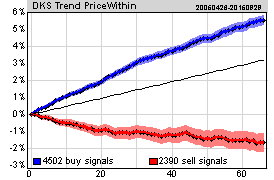
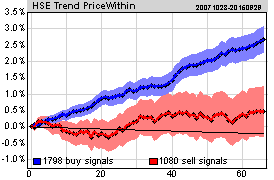
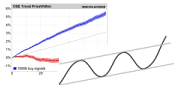
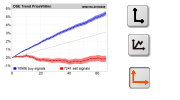
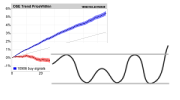
Figure 1: Average price development 66 days after the stocks were in rising trends (blue line) and falling trends (red line) in Investtech’s medium long term technical charts. The width of the shaded area is one standard deviation from the average estimator – the narrower the variance area, the better the estimate. Average benchmark development is the black line. Click the images for bigger versions.
| Average return after 66 days | Norway | Sweden | Denmark | Finland | Weighted average |
| Buy signal, stock in rising tend | 5.4 % | 5.5 % | 5.5 % | 2.7 % | 5.3 % |
| Sell signal, stock in falling trend | -0.1 % | 2.0 % | -1.7 % | 0.5 % | 1.3 % |
| Benchmark index | 3.1 % | 4.0 % | 3.2 % | 2.5 % | 3.5 % |
| Relative return | Norge | Sverige | Danmark | Finland | Weighted average |
| Buy signal, stock in rising tend | 2.3 ppt | 1.5 ppt | 2.3 ppt | 0.2 ppt | 1.9 ppt |
| Sell signal, stock in falling trend | -3.2 ppt | -2.0 ppt | -4.9 ppt | -2.0 ppt | -2.2 ppt |
ppt: percentage points. The difference between average return from stocks that have triggered signals and average benchmark development.
Stocks in rising trends have a clearly positive price development the next 66 days on average, and price development clearly better than average benchmark development. Similarly stocks in falling trends have developed far weaker than benchmark in the next 66 days.
The calculations are done based on a large data set for a relatively long time period and for four different countries. The uncertainty of the estimate, measured by standard deviation, is fairly low, with high statistical T values. The results are considered robust in spite of the lack of independence between samples (see the Data and Signals section).
If you want to learn more....
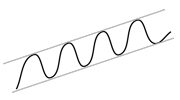
Rising trend.
Read the theory and see which stocks are in a rising trend right now.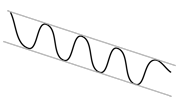
Falling trend.
Read the theory and see which stocks are in a falling trend right now.
Investtechs forskningsarbete baseras på studier av mer än 350.000 signaler från trender
i börsnoterade nordiska aktier från 1996 till 2015.
Praktisk användning - Verktyg - Statistik - Algoritmer - Teori
Trendbibeln - startsida Mer om Investtechs forskning
Trendbibeln är skriven av forskningschef Geir Linløkken under 2016. Forskningsteamet bakom Trendbibeln består av seniorforskarna Asbjørn Taugbøl och Fredrik Tyvand, samt Linløkken själv.
Investtech har arbetat med forskning inom behavioural finance, teknisk och kvantitativ aktieanalys sedan 1997. Företaget har utvecklat ett analyssystem som bland annat identifierar trender, stöd och motstånd, formationer och volymmönster i aktiekurser, och ger köp- och sälj-rekommendationer baserat på detta. Investtech gör omfattande användning av avancerade matematiska algoritmer och tunga statistiska metoder i sina dataprogram och internetbaserade abonnemangstjänster.
Investtech ei takaa analyysien tarkkuutta tai kattavuutta. Kaikkien analyysien tuottamien neuvojen ja signaalien käyttäminen on täysin käyttäjän vastuulla. Investtech ei vastaa mistään tappioista, jotka saattavat syntyä Investtechin analyysien käytön seurauksena. Mahdollisten eturistiriitojen yksityiskohdat mainitaan aina sijoitusneuvon yhteydessä. Lisätietoja Investtechin analyyseistä löytyy täältä disclaimer.
Investtech ei takaa analyysien tarkkuutta tai kattavuutta. Kaikkien analyysien tuottamien neuvojen ja signaalien käyttäminen on täysin käyttäjän vastuulla. Investtech ei vastaa mistään tappioista, jotka saattavat syntyä Investtechin analyysien käytön seurauksena. Mahdollisten eturistiriitojen yksityiskohdat mainitaan aina sijoitusneuvon yhteydessä. Lisätietoja Investtechin analyyseistä löytyy täältä disclaimer.


 Oslo Børs
 Stockholmsbörsen
 Københavns Fondsbørs
 Helsingin pörssi
 World Indices
 US Stocks
 Toronto Stock Exchange
 London Stock Exchange
 Euronext Amsterdam
 Euronext Brussel
 DAX
DAX CAC 40
 Mumbai S.E.
 Commodities
 Currency
 Cryptocurrency
 Exchange Traded Funds
 Investtech Indices