Three exciting buy opportunities - Price breakouts
Published May 02, 2019
The market showed a flat development on Tuesday and Nifty 50 (NIFTY) ended the day at 11748 points (-0.06 per cent). Overall the month of April showed a gain of 1.1 %. Needless to say why the market is hovering around its all time high levels. Clearly it is eagerly waiting for more clues from the election results expected to be out in three weeks. Till then fingers crossed.
We have managed to find good trading opportunities for you in the short to medium term. We went through the Top 50 list of stocks that is automatically updated every day based on the score that Investtech's algorithms allocate to every NSE listed stock. This is based on various factors like position of the stock with respect to the underlying trend, volume balance indicator, nearness of price to support and resistance and finally any price formations or breakouts. The score varies between +100 and -100 points. Out of all stocks, those that scores the highest are chosen in Top 50 'positive' and those with the most negative score get placed in Top 50 'negative'. Today we have analysed three positive stocks.
Bandhan Bank Ltd (BANDHANBNK.NS) Close: 599.45
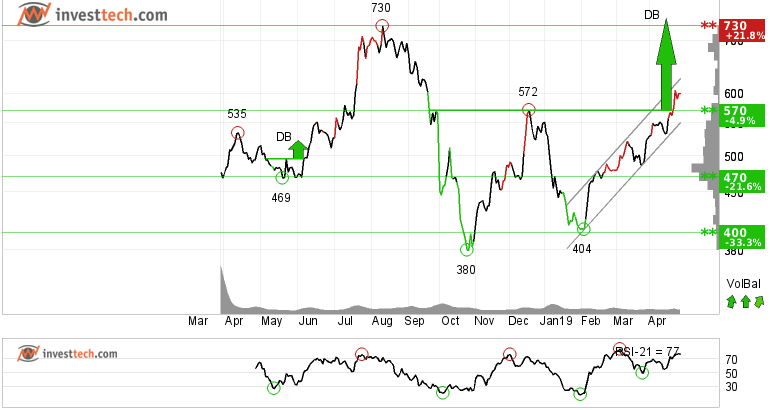
Bandhan Bank Ltd was listed on the National Stock Exchange in March last year, and has seen almost all kinds of price behaviours since then. Currently the stock is inside a rising trend channel in the medium term chart. It has given a buy signal from price breakout through the resistance at 570 rupees. A double bottom formation is now established and the stock is expected to rise to 746 or more. The next resistance is also around the 730 levels or 21.8 per cent higher from last close. There is support around 550 and 523 rupees in the short term.
Positive volume balance and strong momentum support the rising stock price. Bandhan Bank Ltd. is overall assessed as technically positive in the short to medium term.
The stock is volatile with an average rate of around 23 per cent on a monthly basis.
Recommendation one to six months: Positive
Aurobindo Pharma Limit (AUROPHARMA.NS) Close: 819.05
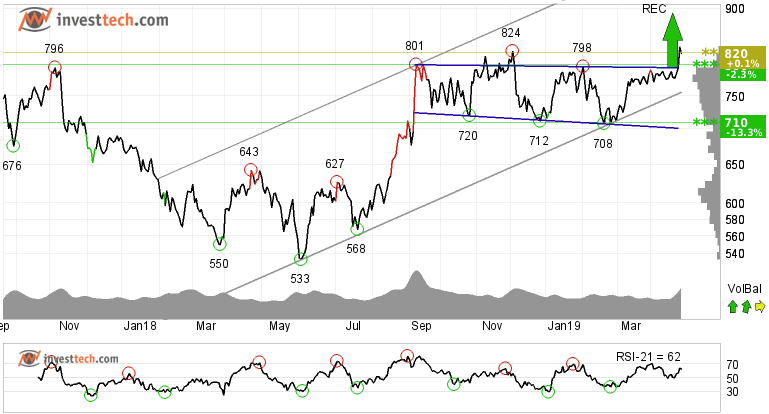
Aurobindo Pharma Limited is in a rising trend channel in the medium term. This signals increasing optimism among investors and indicates continued rise. The stock has given a buy signal from a rectangle formation by breaching through the resistance at 796 rupees both in the medium and long term. Further rise to 891 or more is signalled. There is support around 790-777 rupees.
The price breakout has been supported by a spike in volume, which is a positive sign. The stock is currently testing the resistance at rupee 820. This may give a negative reaction in the short term. However, given its position and underlying strength in short and medium term charts, the stock is considered a positive candidate.
Recommendation one to six months: Positive
L&T Technology Service (LTTS.NS) Close: 1737.30
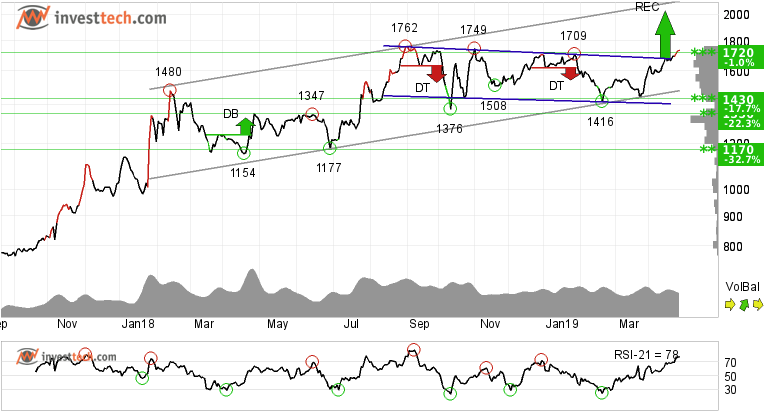
L&T Technology Services Limited is in a rising trend channel both in the medium and long term. This shows that investors over time have bought the stock at higher prices and indicates good development for the company. The stock has given a price breakout from a rectangle formation and is above the resistance at 1720 rupees. Further rise to 2026 or more is signalled. The stock may find resistance at its earlier resistance at 1762, hence one must be cautious around that level. In case of any reaction on the downside, there is support around 1707 and 1620 rupees.
The short term momentum is very strong as the RSI value is above 70. This indicates that lately the investors have been optimistic about the stock. This is uplifting for the stock's near term future.
Recommendation one to six months: Positive
The analyses are based on closing price as per April 30, 2019. Maintaining proper stop loss is always recommended.
Kirjoittaja

Analyst
Investtech
Archive:
24 April: Exclusive research report: Rectangles and return from breakouts
17 April: Stock with 20 per cent upside potential
11 April: Three buy opportunities, price-volume breakout
29 March: Two stocks to stay from
27 March: Recent breakouts in three stocks, short term opportunity
21 March: Three buy and one sell
12 March: Cement stocks are posing good opportunity
08 March: Clear breakout and reversal from intermediate downtrend
07 March: Deepak Nitrite Limited looks promising to enter into a trade
06 March: Three buy candidates for medium to long term
28 February: Breakout in these three stocks invites for early opportunity
26 February: Two buy opportunities for the near term future
21 February: Stocks with RSI above 70, based on our research
19 February: Close to selling point, time to be cautious
15 February: These two sugar stocks look promising
14 February: Three short to medium term opportunities
08 February: One buy and one sell in stocks while index suggests caution
06 February: One buy and one sell, short to medium term opportunities
01 February: Upside breakout from price formations
30 January: Buying opportunity: Reversing from trend channel support
9 January: One positive and one to stay away from
2 January: A good investment opportunity
2018
21 December: Good buying opportunities
14 December: Positive on these three stocks
11 December: One buy and one sell signal
07 December: Sell Signals in Three Big Stocks
04 December: Highest scorer of our Top 50 list
30 November: Positive stocks with 5-11 per cent upside potential
28 November: Buy signal on high volume
27 November: One Buy and One Sell Signal
23 November: Fear dominates these stocks
21 November: Sell signal, time to stay away
20 November: Early opportunity from short term buy signal
16 November: Two Buy Signals and One Sell Signal
15 November: Buy signal in this one
13 November: Big auto stocks comparison
09 November: What to wait for?
06 November: Banking stocks look positive
02 November: Positive on this one
01 November: TECHM, NIFTY50 and Hausse
31 October: What are investors thinking?
30 October: Bullish on these three stocks
26 October: Three potential candidates to ride on
24 October: Three big Metal stocks, Seasonal variation
22 October: Among top performers on our Top 50 list
18 October: Three stocks investors should stay away from
17 October: Flowing against the tide
16 October: Positive on these 2 stocks
11 October: Over 45 per cent rise
9 October: The Indian banking space
5 October: Nifty closes at a crucial level
2 October: Price formations in the long-term charts
28 September: Positive on Biocon Limited
"Investtech analysoi markkinoiden psykologiaa ja antaa konkreettisia kaupankäyntisuosituksia päivittäin."

Partner & Senior Advisor - Investtech
Investtech ei takaa analyysien tarkkuutta tai kattavuutta. Kaikkien analyysien tuottamien neuvojen ja signaalien käyttäminen on täysin käyttäjän vastuulla. Investtech ei vastaa mistään tappioista, jotka saattavat syntyä Investtechin analyysien käytön seurauksena. Mahdollisten eturistiriitojen yksityiskohdat mainitaan aina sijoitusneuvon yhteydessä. Lisätietoja Investtechin analyyseistä löytyy täältä disclaimer.
Investtech ei takaa analyysien tarkkuutta tai kattavuutta. Kaikkien analyysien tuottamien neuvojen ja signaalien käyttäminen on täysin käyttäjän vastuulla. Investtech ei vastaa mistään tappioista, jotka saattavat syntyä Investtechin analyysien käytön seurauksena. Mahdollisten eturistiriitojen yksityiskohdat mainitaan aina sijoitusneuvon yhteydessä. Lisätietoja Investtechin analyyseistä löytyy täältä disclaimer.


 Oslo Børs
 Stockholmsbörsen
 Københavns Fondsbørs
 Helsingin pörssi
 World Indices
 US Stocks
 Toronto Stock Exchange
 London Stock Exchange
 Euronext Amsterdam
 Euronext Brussel
 DAX
DAX CAC 40
 Mumbai S.E.
 Commodities
 Currency
 Cryptocurrency
 Exchange Traded Funds
 Investtech Indices


