Buy before December – Seasonal variations on the Scandinavian Stock Exchanges
Published in English on 16 October 2015. Norwegian original here >>
Investtech’s statistics based on three decades of data show that the Scandinavian stock exchanges rise from early winter until early summer. We have studied this seasonality in further detail below.
Statistical results
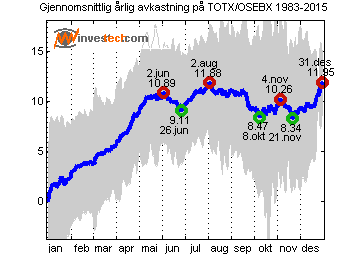
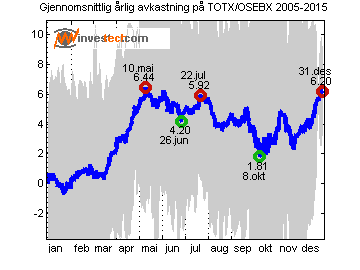
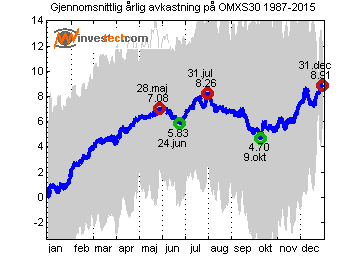
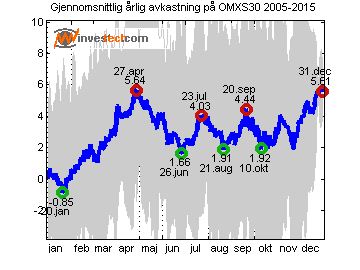
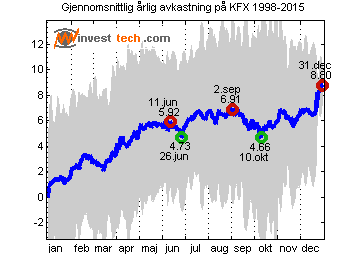
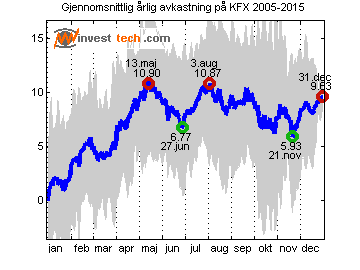
Investtech has calculated average price development throughout the year for the Scandinavian stock exchanges. The results are shown in the charts below. The left hand charts show the whole period for which we have data, while the right hand charts show the past ten years. The shaded areas show monthly standard deviation, which is a measurement of uncertainty.
Figure 1. Norway. Average annual return on the Oslo Stock Exchange for 1983-2015 and 2005-2015.
Figure 2. Sweden. Average annual return on the Stockholm Stock Exchange for 1987-2015 and 2005-2015.
Figure 3. Denmark. Average annual return on the Copenhagen Stock Exchange for 1998-2015 and 2005-2015.
Analysis
Historically the stock exchanges in Norway, Sweden and Denmark all hit bottom in the autumn. On average the exchanges have developed neutrally in October and November, and then seen a rise in December.
The often discussed January effect seems to have become a December effect instead. The exchanges still show very positive development during winter and spring.
Risk
Figures 1 to 3 show that the standard deviation, visualised by the shaded areas, is large. This is due to variations from year to year, and October and November are no exceptions. On average, however, these months are neutral. December is the month with the least variation.
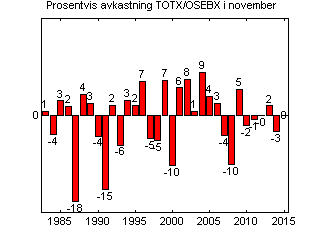
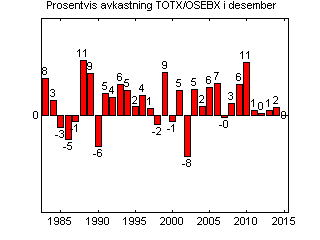
Figure 4. Return in November and December on the Oslo Stock Exchange from 1983 to 2015.
Figure 4 shows return in November and December for 1983-2015 on the Oslo Stock Exchange. Only three years have seen a fall in December in excess of three per cent. There are also 15 years with a rise in excess of three per cent. On average the rise has been 2.8 per cent and December has ended positively for nine of the last ten years.
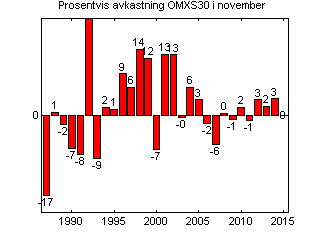
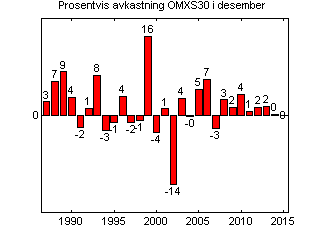
Figure 5. Return in November and December on the Stockholm Stock Exchange from 1987 to 2015.
Figure 5 shows return in November and December for the years 1987-2015 on the Stockholm Stock Exchange. There are only two years with a fall in December in excess of three per cent. There are also ten years with a rise in excess of three per cent. On average the rise has been 1.9 per cent and December has ended positively for nine of the past ten years. November has also been a very positive period on the Stockholm Exchange, with an average rise of 2.1 per cent since 1987.
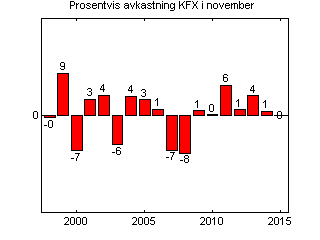
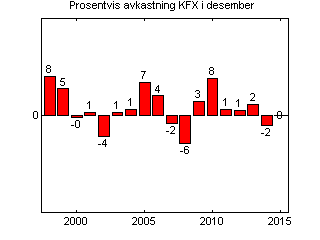
Figure 6. Return in November and December on the Copenhagen Stock Exchange from 1998 to 2015.
Figure 6 shows return in November and December for 1998-2015 on the Copenhagen Stock Exchange. There are two years with a fall in December in excess of three per cent, and five years with a rise in excess of three per cent. On average the rise has been 1.7 per cent and December has ended positively in seven of the past ten years.
Assessment
October and November have statistically been good months to buy into or buy more on the Scandinavian stock exchanges.
If the Scandinavian exchanges follow the same pattern as in an average year, the coming weeks will be a good time to buy stocks.
Investors who have been out of the market or not fully invested recently, may find this a good time to increase their holdings. There are large fluctuations ahead, but statistically moving upwards more than downwards.
Kirjoittaja

Perustaja ja tutkimustyön johtaja
Investtech
Investtech ei takaa analyysien tarkkuutta tai kattavuutta. Kaikkien analyysien tuottamien neuvojen ja signaalien käyttäminen on täysin käyttäjän vastuulla. Investtech ei vastaa mistään tappioista, jotka saattavat syntyä Investtechin analyysien käytön seurauksena. Mahdollisten eturistiriitojen yksityiskohdat mainitaan aina sijoitusneuvon yhteydessä. Lisätietoja Investtechin analyyseistä löytyy täältä disclaimer.
Investtech ei takaa analyysien tarkkuutta tai kattavuutta. Kaikkien analyysien tuottamien neuvojen ja signaalien käyttäminen on täysin käyttäjän vastuulla. Investtech ei vastaa mistään tappioista, jotka saattavat syntyä Investtechin analyysien käytön seurauksena. Mahdollisten eturistiriitojen yksityiskohdat mainitaan aina sijoitusneuvon yhteydessä. Lisätietoja Investtechin analyyseistä löytyy täältä disclaimer.


 Oslo Børs
 Stockholmsbörsen
 Københavns Fondsbørs
 Helsingin pörssi
 World Indices
 US Stocks
 Toronto Stock Exchange
 London Stock Exchange
 Euronext Amsterdam
 Euronext Brussel
 DAX
DAX CAC 40
 Mumbai S.E.
 Commodities
 Currency
 Cryptocurrency
 Exchange Traded Funds
 Investtech Indices