
 Oslo Børs
 Stockholmsbörsen
 Københavns Fondsbørs
Investeringsforeninger
Københavns Fondsbørs
Investeringsforeninger
 Helsingin pörssi
 World Indices
 US Stocks
US 30
Nasdaq 100
US 500
US Stocks
US 30
Nasdaq 100
US 500
 Toronto Stock Exchange
 London Stock Exchange
 Euronext Amsterdam
 Euronext Brussel
 DAX
SDAX
TECDAX
Frankfurt
CDAX
MDAX
Prime Standard
DAX
SDAX
TECDAX
Frankfurt
CDAX
MDAX
Prime Standard
 CAC 40
 Mumbai S.E.
National S.E.
Mumbai S.E.
National S.E.
 Commodities
 Currency
 Cryptocurrency
 Exchange Traded Funds
 Investtech Indices
Big Auto Stocks Comparison: Performance in the past and likely future!
Published November 13, 2018
Webinar November 14
Join our free online webinar on November 14 . Analyst Kiran Shroff and Country Manager Jan Marius van Leeuwen will give an introduction to Investtech's analyses and present stock picking tools & strategies.
The Nifty 50 index is not giving any clear direction right now, as to where it is heading towards and if the buyers are in charge or the sellers. It has just been swinging between 10600 and 10400 points since last week.
So we decided to look at something very interesting today: performance comparison of stocks in the same sector over different time frames. This feature is available as 'Compare' on our website, where you go to one stock, click the Compare icon and write in other stocks' names of the same/other sectors to weigh their relative history.
So let us take a look at the sector which has been a pioneer, on a few earlier occasions, of an upcoming correction or starting of a new trend. Yes, the auto sector (the most underperforming sector in today's trade).
We will compare the Nifty 50 index with four big auto stocks that are also components of the big index, how they have relatively performed in all time frames, short, medium and long term. Maruti Suzuki Limited, Eicher Motors Limited, Tata Motors Limited and Mahindra and Mahindra Limited are part of this comparison. This study can be very useful for not only investors but also hedgers and pair-traders who trade by selling one stock while buying another of the same sector.
Note: To start with, the base point has been taken as zero in all time frames to keep the comparison simple and easy to read.
Short term:
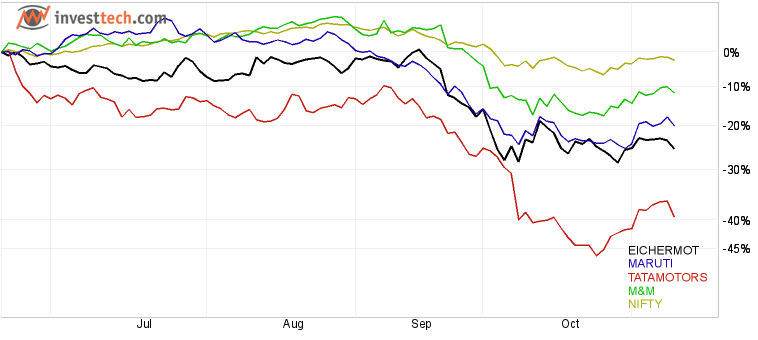
Our first chart is the short term comparison. As you can see, the starting point is the end of June this year, and clearly all auto stocks have underperformed vs. the main index since then. As I suggested earlier, the auto sector can be an early pioneer of the forthcoming broader movement in the market. It can be clearly seen that auto stocks led the recent fall in the market which had only started to correct couple of months earlier than the broader market.
In the graph above, Nifty 50 is the best performer while TATAMOTORS is the worst. The stock fell over 40 per cent in the given period while other stocks lost between 10 and 30 per cent of their stock price.
Medium term:
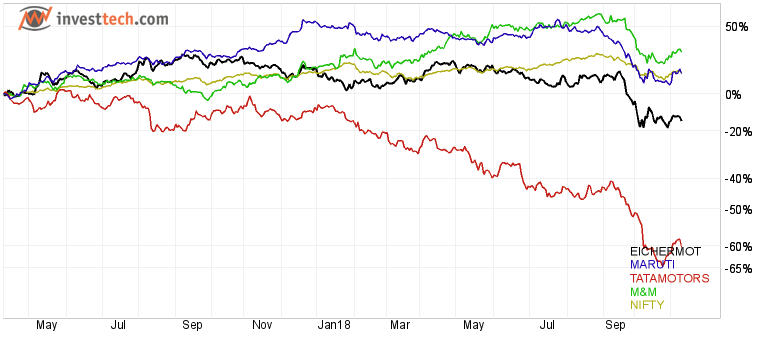
The second chart is the medium term comparison with a time frame of approximately 20 months. During this duration, the index Nifty 50 has been somewhere in the middle, but with positive returns, while again TATAMOTORS lead the way among the worst performers by losing 60 per cent of its value. On the other hand M&M has given better returns than all the others in our list.
Long term:
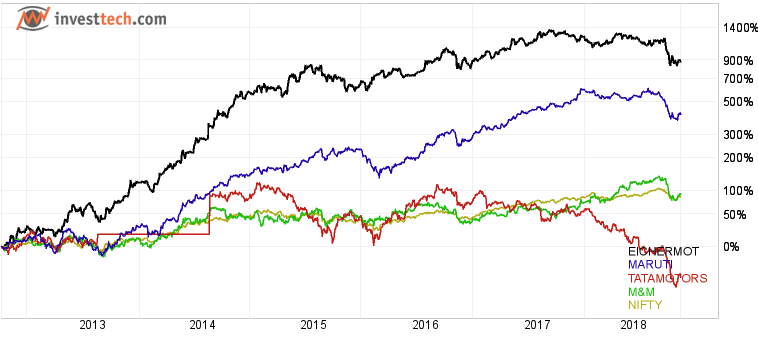
Lastly is the long term comparison that stretches over many years. In this graph, EICHER steals the show. Its returns have been better than that of MARUTI and all others in this segment, with the stock gaining over 1200 per cent over a period of 5 years before it started to correct in late 2018. Clearly TATAMOTORS has underperformed in this time frame as well, with negative returns until today. In the long term graph, the auto sector has been the harbinger of the last bull run that we have seen in the Indian stock markets for the last half decade.
What conclusion can we derive from this? Both in the short and long term, the auto sector has respectively under- and outperformed the broader market indices. So will it be the guiding force behind the next big market move? We will probably see that in the coming months or quarters.
The analyses are based on closing price as per November 12, 2018. Maintaining proper stop loss is always recommended.
Kirjoittaja

Analyst
Investtech
Archive:
09 November: What to wait for?
06 November: Banking stocks look positive
02 November: Positive on this one
01 November: TECHM, NIFTY50 and Hausse
31 October: What are investors thinking?
30 October: Bullish on these three stocks
26 October: Three potential candidates to ride on
24 October: Three big Metal stocks, Seasonal variation
22 October: Among top performers on our Top 50 list
18 October: Three stocks investors should stay away from
17 October: Flowing against the tide
16 October: Positive on these 2 stocks
11 October: Over 45 per cent rise
9 October: The Indian banking space
5 October: Nifty closes at a crucial level
2 October: Price formations in the long-term charts
28 September: Positive on Biocon Limited
"Investtech analysoi markkinoiden psykologiaa ja antaa konkreettisia kaupankäyntisuosituksia päivittäin."

Partner & Senior Advisor - Investtech


Investtech ei takaa analyysien tarkkuutta tai kattavuutta. Kaikkien analyysien tuottamien neuvojen ja signaalien käyttäminen on täysin käyttäjän vastuulla. Investtech ei vastaa mistään tappioista, jotka saattavat syntyä Investtechin analyysien käytön seurauksena. Mahdollisten eturistiriitojen yksityiskohdat mainitaan aina sijoitusneuvon yhteydessä. Lisätietoja Investtechin analyyseistä löytyy täältä disclaimer.
Investtech ei takaa analyysien tarkkuutta tai kattavuutta. Kaikkien analyysien tuottamien neuvojen ja signaalien käyttäminen on täysin käyttäjän vastuulla. Investtech ei vastaa mistään tappioista, jotka saattavat syntyä Investtechin analyysien käytön seurauksena. Mahdollisten eturistiriitojen yksityiskohdat mainitaan aina sijoitusneuvon yhteydessä. Lisätietoja Investtechin analyyseistä löytyy täältä disclaimer.
Päätoimisto
Strandveien 171366 Lysaker, Norway
Tutkimusosasto
Instituttveien 102007 Kjeller, Norway