
 Oslo Børs
 Stockholmsbörsen
 Københavns Fondsbørs
Investeringsforeninger
Københavns Fondsbørs
Investeringsforeninger
 Helsingin pörssi
 World Indices
 US Stocks
US 30
Nasdaq 100
US 500
US Stocks
US 30
Nasdaq 100
US 500
 Toronto Stock Exchange
 London Stock Exchange
 Euronext Amsterdam
 Euronext Brussel
 DAX
SDAX
TECDAX
Frankfurt
CDAX
MDAX
Prime Standard
DAX
SDAX
TECDAX
Frankfurt
CDAX
MDAX
Prime Standard
 CAC 40
 Mumbai S.E.
National S.E.
Mumbai S.E.
National S.E.
 Commodities
 Currency
 Cryptocurrency
 Exchange Traded Funds
 Investtech Indices
Two buy opportunities for the near term future
Published February 26, 2019
Today we have chosen Nifty 500 listed stocks that have given recent breakouts. The momentum indicator RSI in the stocks is rising and that is always a good sign. In our previous article we wrote about the RSI indicator and how stocks have performed after breaking above and below the 70 and 30 levels. In our next article we will write about trend, the performance of stocks in a rising and a falling trend. For now let us focus on the analysis of two good trading opportunities.
The broader market showed a small gain Monday, and Nifty 50 (NIFTY) ended the day at 10880 points, which is an increase of 0.82 per cent. The index has now risen for the fourth day in a row. 919 shares were up and 543 were down, while 76 remained unchanged, and there was no trading in 187 shares.
3M India Limited (3MINDIA.NS) Close: 23648.00
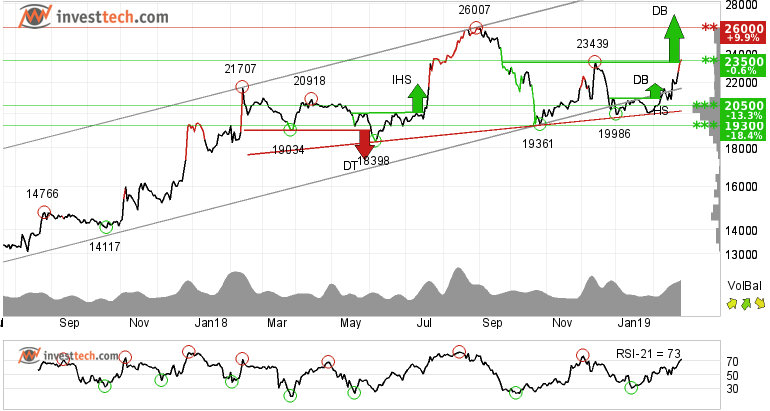
3M India Limited shows strong development within a rising trend channel in the medium to long term. In the last 5 years the stock has risen by 5.6 times.
In the last couple of months the stock has been in a sideways trend until the buyers decided to establish support around 19300 and take the price higher. The stock has given a buy signal from a double bottom formation and a target of 27091 or higher is given. There is resistance around 26000 rupees and support at 21000 rupees.
The stock has strong positive momentum and positive volume balance in the medium term. The stock is overall assessed as technically positive for the medium term.
Recommendation one to six months: Positive
PI Industries Limited (PIIND.NS) Close: 920.65
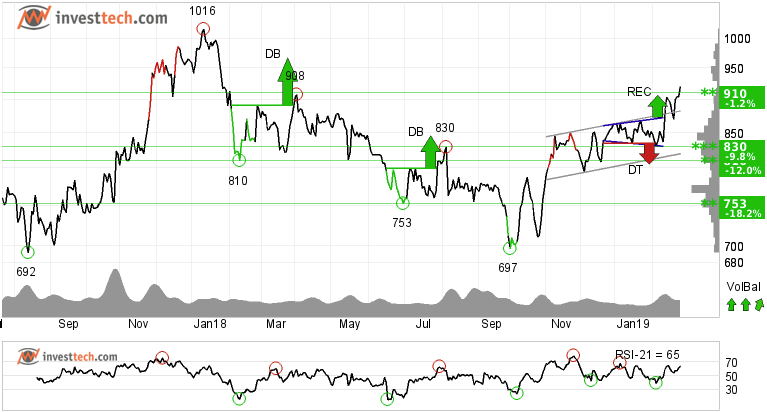
PI Industries Limited has been popping up on our Top 50 list for a while and it was time to write an analysis of it. The stock has broken out from the ceiling of the rising trend channel and eventually the resistance at 910 rupees in the medium term. This indicates that the buyers have been aggressive in taking the prices higher. The volume balance indicator is also very positive. The momentum indicator RSI is rising and together this indicates support for the rising stock price.
On the downside there is support at 910 and 852 rupees in the medium and short term respectively. There could be resistance around 1016 levels which is its earlier top made in January 2018.
Recommendation one to six months: Positive
The analyses are based on closing price as per February 25, 2019. Maintaining proper stop loss is always recommended.
Kirjoittaja

Analyst
Investtech
Archive:
25 February: Stocks with RSI above 70, based on our research
19 February: Close to selling point, time to be cautious
15 February: These two sugar stocks look promising
14 February: Three short to medium term opportunities
08 February: One buy and one sell in stocks while index suggests caution
06 February: One buy and one sell, short to medium term opportunities
01 February: Upside breakout from price formations
30 January: Buying opportunity: Reversing from trend channel support
9 January: One positive and one to stay away from
2 January: A good investment opportunity
2018
21 December: Good buying opportunities
14 December: Positive on these three stocks
11 December: One buy and one sell signal
07 December: Sell Signals in Three Big Stocks
04 December: Highest scorer of our Top 50 list
30 November: Positive stocks with 5-11 per cent upside potential
28 November: Buy signal on high volume
27 November: One Buy and One Sell Signal
23 November: Fear dominates these stocks
21 November: Sell signal, time to stay away
20 November: Early opportunity from short term buy signal?
16 November: Two Buy Signals and One Sell Signal
15 November: Buy signal in this one
13 November: Big auto stocks comparison
09 November: What to wait for?
06 November: Banking stocks look positive
02 November: Positive on this one
01 November: TECHM, NIFTY50 and Hausse
31 October: What are investors thinking?
30 October: Bullish on these three stocks
26 October: Three potential candidates to ride on
24 October: Three big Metal stocks, Seasonal variation
22 October: Among top performers on our Top 50 list
18 October: Three stocks investors should stay away from
17 October: Flowing against the tide
16 October: Positive on these 2 stocks
11 October: Over 45 per cent rise
9 October: The Indian banking space
5 October: Nifty closes at a crucial level
2 October: Price formations in the long-term charts
28 September: Positive on Biocon Limited
"Investtech analysoi markkinoiden psykologiaa ja antaa konkreettisia kaupankäyntisuosituksia päivittäin."

Partner & Senior Advisor - Investtech


Investtech ei takaa analyysien tarkkuutta tai kattavuutta. Kaikkien analyysien tuottamien neuvojen ja signaalien käyttäminen on täysin käyttäjän vastuulla. Investtech ei vastaa mistään tappioista, jotka saattavat syntyä Investtechin analyysien käytön seurauksena. Mahdollisten eturistiriitojen yksityiskohdat mainitaan aina sijoitusneuvon yhteydessä. Lisätietoja Investtechin analyyseistä löytyy täältä disclaimer.
Investtech ei takaa analyysien tarkkuutta tai kattavuutta. Kaikkien analyysien tuottamien neuvojen ja signaalien käyttäminen on täysin käyttäjän vastuulla. Investtech ei vastaa mistään tappioista, jotka saattavat syntyä Investtechin analyysien käytön seurauksena. Mahdollisten eturistiriitojen yksityiskohdat mainitaan aina sijoitusneuvon yhteydessä. Lisätietoja Investtechin analyyseistä löytyy täältä disclaimer.
Päätoimisto
Strandveien 171366 Lysaker, Norway
Tutkimusosasto
Instituttveien 102007 Kjeller, Norway