Global stocks: BITCOIN in a rush
Published May 13, 2019
Bitcoin is in a rush. Since our last published analysis on April 3 and til the time we write this analysis on May 13 at 2030 hrs CET, the cryptocurrency has risen from 4958 to 7785 dollars, which is up by 57 percent.
What is driving the crypto giant crazy? It could be anything from US-China tussle to pure speculation, or simply buyers interest. No one can give a concrete fundamental reason behind this leap. This is where technical analysis makes itself extremely useful and handy. Just by looking at the charts early in April, one could have obtained certain hints that there is something cooking behind the scenes and awaiting our attention. And we at Investtech like morning birds gave our readers an early wake-up call. We had given a weak buy on April 3 at a price of 4957.52 dollars. What is in store ahead?
Bitcoin (BTC.CPT) Close: 7 112.33 (-140.23), May 13 (intraday), 2019
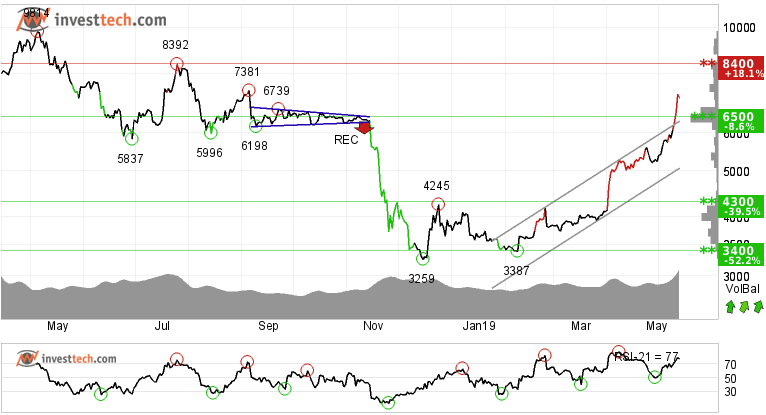
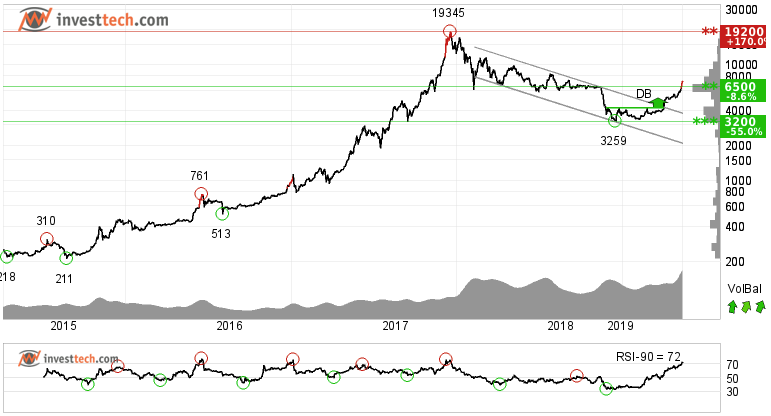
Looking at last friday's closing price and the latest uploaded intraday charts on Investtech's website, it is clearly a buy signal in all time frames whether short, medium or long term as the price has broken out of its resistance area around 6500 dollars.
Investors have paid higher prices over time to buy in Bitcoin and the price has broken through the ceiling of rising trend channel in the medium term. The cryptocurrency has support at 6500 and resistance at 8400.
In the long term chart, the price has broken out of the long term falling trend channel and also gave a breakout from a double bottom formation. The longer term RSI-90 is also above 70 which indicated underlying strength and shows rising momentum in the crypto.
Positive volume balance, with high volume on days of rising prices and low volume on days of falling prices, strengthens the price in the short term. The short term momentum of the stock is strongly positive, with RSI above 70. This indicates increasing optimism among investors and further price increase for Bitcoin.
We upgrade our recommendation for Bitcoin as technically positive from weak positive.
The analyses are based on closing price as per May 13, intraday, 2019
Note: These instruments are traded in currency based on the exchange or country they are listed on.
Kirjoittaja

Analyst
Investtech
"Investtech analysoi markkinoiden psykologiaa ja antaa konkreettisia kaupankäyntisuosituksia päivittäin."

Partner & Senior Advisor - Investtech
Investtech ei takaa analyysien tarkkuutta tai kattavuutta. Kaikkien analyysien tuottamien neuvojen ja signaalien käyttäminen on täysin käyttäjän vastuulla. Investtech ei vastaa mistään tappioista, jotka saattavat syntyä Investtechin analyysien käytön seurauksena. Mahdollisten eturistiriitojen yksityiskohdat mainitaan aina sijoitusneuvon yhteydessä. Lisätietoja Investtechin analyyseistä löytyy täältä disclaimer.
Investtech ei takaa analyysien tarkkuutta tai kattavuutta. Kaikkien analyysien tuottamien neuvojen ja signaalien käyttäminen on täysin käyttäjän vastuulla. Investtech ei vastaa mistään tappioista, jotka saattavat syntyä Investtechin analyysien käytön seurauksena. Mahdollisten eturistiriitojen yksityiskohdat mainitaan aina sijoitusneuvon yhteydessä. Lisätietoja Investtechin analyyseistä löytyy täältä disclaimer.


 Oslo Børs
 Stockholmsbörsen
 Københavns Fondsbørs
 Helsingin pörssi
 World Indices
 US Stocks
 Toronto Stock Exchange
 London Stock Exchange
 Euronext Amsterdam
 Euronext Brussel
 DAX
DAX CAC 40
 Mumbai S.E.
 Commodities
 Currency
 Cryptocurrency
 Exchange Traded Funds
 Investtech Indices


