Global stocks: Positive candidates, two German and two Danish stocks
Published July 03, 2019
We are diversifying our analysis today and focusing on two European markets with two liquid and positive candidates from each market. All stocks are independent from each other in terms of sector and behaviour given market conditions.
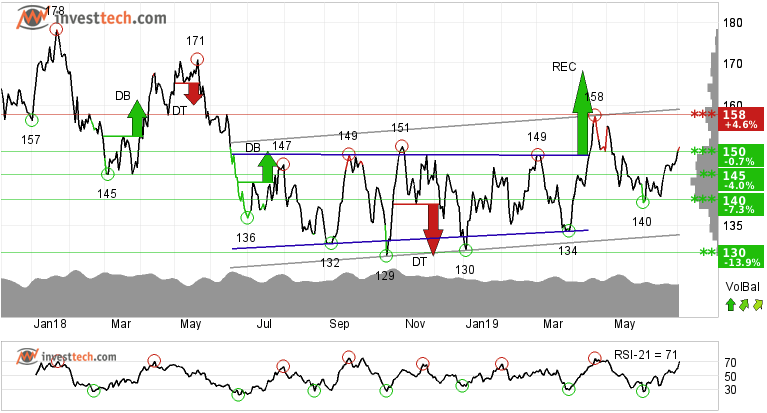
Volkswagen AG Vzo o.N. (VOW3.DE) Close: 151.00
Volkswagen AG Vzo o.N. is inside a weak rising trend channel in both medium and long term charts. In April the stock broke out from a large rectangle formation that stretches back more than a year. However, the price retraced back and neutralized the formation.
Now the price of the automobile giant has broken above the resistance of 150 euros once again after making a higher low at 140. This could be the start of a new uptrend. On the upside there is resistance around the 158 level. A break and close above that level may initiate fresh buying in the stock. There is support around 145 euros.
Both volume balance and momentum indicators are positive and support the underlying rise in price. The stock is overall assessed as technically positive in the medium to long term.
Investtech's outlook (one to six months): Positive
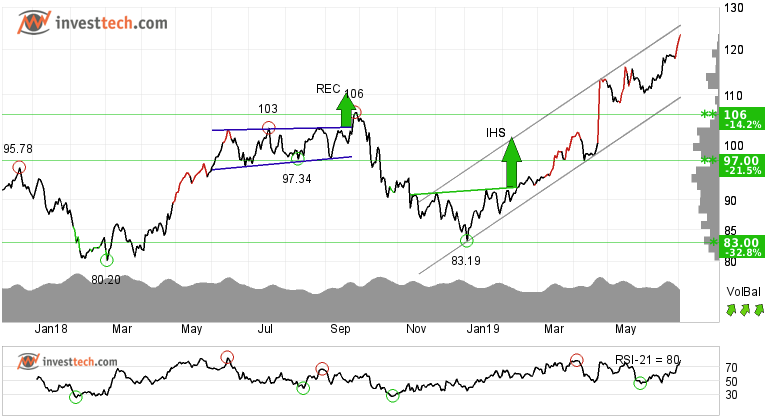
Sap SE (SAP.DE) Close: 123.50
Investors have paid higher prices over time to buy Sap SE and the stock is in a rising trend channel in the medium to long term. This signals increasing optimism among investors and indicates continued rise.
This technology and software stock is in all-time-high and hence no resistance can be marked in the medium term chart. On the other hand, the stock has support at 113 euros in the short term.
Positive volume balance indicates that buyers are aggressive while sellers are passive, and strengthens the stock. RSI is above 70 after a good price increase the past weeks. The stock has strong positive momentum and further increase is indicated.
Investtech's outlook (one to six months): Positive
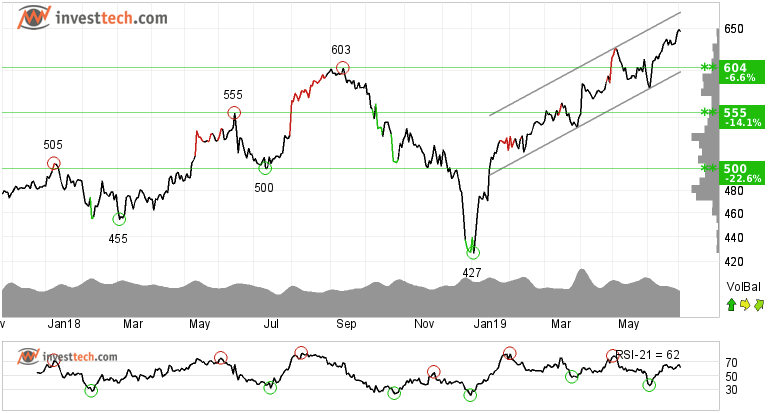
DSV (DSV.CO) Close: 646.40
DSV shows strong development within a rising trend channel in the short, medium and long term. This signals increasing optimism among investors and indicates continued rise. The stock has support at 628 danish kroner. Short term RSI is above 70 after a good price increase the past weeks.
The Industrials Transportation & Logistics company stock price has strong positive momentum in the short term chart. The volume balance indicator is also positive and suggests that more buyers are interested in buying the stock even at higher prices, while sellers on the other hand are passive and unwilling to sell their holding at lower prices. The stock is overall assessed as technically positive in all time frames.
Investtech's outlook (one to six months): Positive
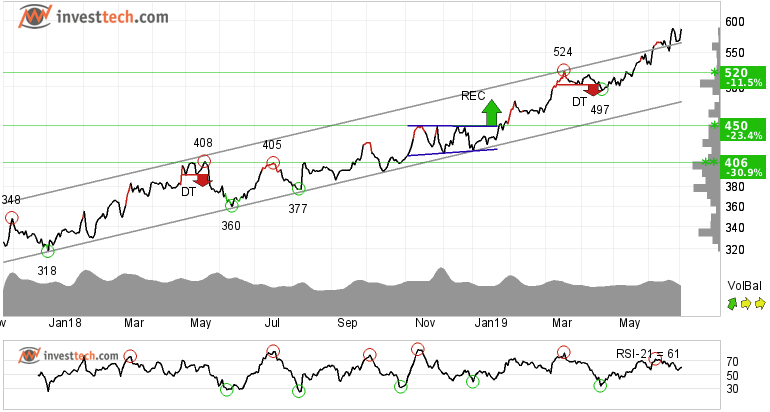
Ørsted (ORSTED.CO) Close: 587.40
Listed on the Nasdaq OMX Copenhagen Exchange, Ørsted has broken the rising trend upwards in the medium term. This signals an even stronger rate of growth in price. Stocks with a breakout above the rising trend channel has given an excess annualized return of 11.2 percentage points in Denmark. More about the research and results for other Scandinavian markets can be studied here.
The price has risen strongly since the positive signal from a rectangle formation in the beginning of the year and has gone up by 30 per cent. The utilities giant has support around 567 danish kroner and very little resistance above last days' close.
The short term volume balance is positive and strengthens the stock both in the short and medium term. It indicates increasing buy interest among investors and an overweight of buyers over sellers.
Investtech's outlook (one to six months): Positive
The analyses are based on closing price as per July 02, 2019
Note: These instruments are traded in currency based on the Exchange or country they are listed on.
Kirjoittaja

Analyst
Investtech
"Investtech analysoi markkinoiden psykologiaa ja antaa konkreettisia kaupankäyntisuosituksia päivittäin."

Partner & Senior Advisor - Investtech
Investtech ei takaa analyysien tarkkuutta tai kattavuutta. Kaikkien analyysien tuottamien neuvojen ja signaalien käyttäminen on täysin käyttäjän vastuulla. Investtech ei vastaa mistään tappioista, jotka saattavat syntyä Investtechin analyysien käytön seurauksena. Mahdollisten eturistiriitojen yksityiskohdat mainitaan aina sijoitusneuvon yhteydessä. Lisätietoja Investtechin analyyseistä löytyy täältä disclaimer.
Investtech ei takaa analyysien tarkkuutta tai kattavuutta. Kaikkien analyysien tuottamien neuvojen ja signaalien käyttäminen on täysin käyttäjän vastuulla. Investtech ei vastaa mistään tappioista, jotka saattavat syntyä Investtechin analyysien käytön seurauksena. Mahdollisten eturistiriitojen yksityiskohdat mainitaan aina sijoitusneuvon yhteydessä. Lisätietoja Investtechin analyyseistä löytyy täältä disclaimer.


 Oslo Børs
 Stockholmsbörsen
 Københavns Fondsbørs
 Helsingin pörssi
 World Indices
 US Stocks
 Toronto Stock Exchange
 London Stock Exchange
 Euronext Amsterdam
 Euronext Brussel
 DAX
DAX CAC 40
 Mumbai S.E.
 Commodities
 Currency
 Cryptocurrency
 Exchange Traded Funds
 Investtech Indices