
 Oslo Børs
 Stockholmsbörsen
 Københavns Fondsbørs
Investeringsforeninger
Københavns Fondsbørs
Investeringsforeninger
 Helsingin pörssi
 World Indices
 US Stocks
US 30
Nasdaq 100
US 500
US Stocks
US 30
Nasdaq 100
US 500
 Toronto Stock Exchange
 London Stock Exchange
 Euronext Amsterdam
 Euronext Brussel
 DAX
SDAX
TECDAX
Frankfurt
CDAX
MDAX
Prime Standard
DAX
SDAX
TECDAX
Frankfurt
CDAX
MDAX
Prime Standard
 CAC 40
 Mumbai S.E.
National S.E.
Mumbai S.E.
National S.E.
 Commodities
 Currency
 Cryptocurrency
 Exchange Traded Funds
 Investtech Indices
The Trend Bible
 Puhelin: +47 21 555 888
 Sähköposti
 Yhteydenottopyyntö
 Vierailukäynti
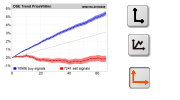
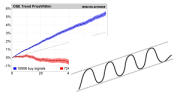
Stocks in rising trends have continued upwards, more so than the market, in short, medium long and long term trends. Trends in Investtechs short term and medium long term charts have given stronger signals than trends in the long term charts.
Research Results Short and Long Term Trends
a) Norway.
b) Sweden.
c) Denmark.
d) Finland.
Figure 1: Short term. Average price development for stocks in rising and falling trends in Investtechs short term technical charts.
a) Norway.
b) Sweden.
c) Denmark.
d) Finland.
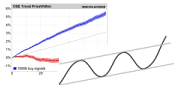
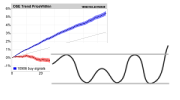
Figure 2: Long term. Average price development for stocks in rising and falling trends in Investtechs long term technical charts.
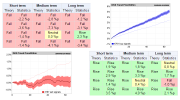
| Relative return, stocks in rising trends | Norway | Sweden | Denmark | Finland | Weighted average |
| Short term | 2.4 ppt | 1.7 ppt | 1.9 ppt | 0.9 ppt | 1.9 ppt |
| Medium long term | 2.3 ppt | 1.5 ppt | 2.3 ppt | 0.2 ppt | 1.8 ppt |
| Long term | 1.3 ppt | 0.4 ppt | 1.7 ppt | -0.6 ppt | 0.8 ppt |
| Relative return, stocks in falling trends | Norway | Sweden | Denmark | Finland | Weighted average |
| Short term | -2.7 ppt | -1.7 ppt | -3.1 ppt | -1.8 ppt | -2.2 ppt |
| Medium long term | -3.2 ppt | -2.0 ppt | -4.9 ppt | -2.0 ppt | -2.8 ppt |
| Long term | -1.5 ppt | -0.5 ppt | -3.0 ppt | +0.4 ppt | -1.2 ppt |
ppt: percentage points
The charts and table above show that stocks in rising trends have continued upwards, more so than the market, for short, medium long and long term trends. The rise is most significant for the short term and medium long term tends, but also the long term charts show significant positive covariation between rising trend and excess return in three months.
Falling trends give a good indicator of negative excess return in the short, medium long and long term. The connection is clearer for short and medium term, also significant in the long term.
To learn more....
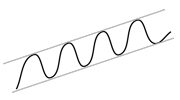
Rising trend. Read the theory and see which stocks are in a rising trend now.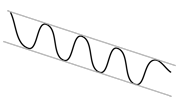
Falling trend. Read the theory and see which are in a falling trend now.
Investtech's reference work based on studies of more than 350,000 signals from trends in stocks listed on
the Nordic stock exchanges from 1996 to 2015.
Practical use - Tools - Statistics - Algorithms - Theory.
The Trend Bible - Start Page More on Investtech's research

The Trend Bible was written in 2016 by Investtechs Head of Research Mr. Geir Linløkken. The research team behind the Trend Bible also consists of Senior Researchers Asbjørn Taugbøl and Fredrik Tyvand.
Investtech has worked on research into behavioural finance and technical and quantitative stock analysis since 1997. The company has developed an analysis system that identifies trends, support and resistance, formations and volume patterns in stock prices, and uses these to generate buy and sell signals. Investtech uses advanced mathematical algorithms and statistical methods in computer programmes and online subscription services.
Investtech ei takaa analyysien tarkkuutta tai kattavuutta. Kaikkien analyysien tuottamien neuvojen ja signaalien käyttäminen on täysin käyttäjän vastuulla. Investtech ei vastaa mistään tappioista, jotka saattavat syntyä Investtechin analyysien käytön seurauksena. Mahdollisten eturistiriitojen yksityiskohdat mainitaan aina sijoitusneuvon yhteydessä. Lisätietoja Investtechin analyyseistä löytyy täältä disclaimer.
Investtech ei takaa analyysien tarkkuutta tai kattavuutta. Kaikkien analyysien tuottamien neuvojen ja signaalien käyttäminen on täysin käyttäjän vastuulla. Investtech ei vastaa mistään tappioista, jotka saattavat syntyä Investtechin analyysien käytön seurauksena. Mahdollisten eturistiriitojen yksityiskohdat mainitaan aina sijoitusneuvon yhteydessä. Lisätietoja Investtechin analyyseistä löytyy täältä disclaimer.
Päätoimisto
Strandveien 171366 Lysaker, Norway
Tutkimusosasto
Instituttveien 102007 Kjeller, Norway