
 Oslo Børs
 Stockholmsbörsen
 Københavns Fondsbørs
Investeringsforeninger
Københavns Fondsbørs
Investeringsforeninger
 Helsingin pörssi
 World Indices
 US Stocks
US 30
Nasdaq 100
US 500
US Stocks
US 30
Nasdaq 100
US 500
 Toronto Stock Exchange
 London Stock Exchange
 Euronext Amsterdam
 Euronext Brussel
 DAX
SDAX
TECDAX
Frankfurt
CDAX
MDAX
Prime Standard
DAX
SDAX
TECDAX
Frankfurt
CDAX
MDAX
Prime Standard
 CAC 40
 Mumbai S.E.
National S.E.
Mumbai S.E.
National S.E.
 Commodities
 Currency
 Cryptocurrency
 Exchange Traded Funds
 Investtech Indices
Brent Crude NYMEX (BZ.FUT)
Slotkoers: 82.96 (-0.71), 3 mei. 2024
Volledig rapport
Algoritmische totaalanalyse
Verkoop (Score: -70)
3 mei. 2024. Dagelijks geactualiseerd.
Analyses

Kort

Medium
Lang
Totaal
Beleggerpsychologie - Behavioral finance - Kwantitatieve analyse - Onderzoeksgebaseerde methoden
Technische analyse - Insider trades - Seizoenvariaties -Intradaghandel
Aandelendata
| Koersdatum | 3 mei. 2024 |
| Valuta | |
| ISIN | |
| Stijging vanaf laagste punt dit jaar | 15.48% |
| Daling vanaf hoogste punt dit jaar | -14.08% |
Automatische technische analyse. Kort
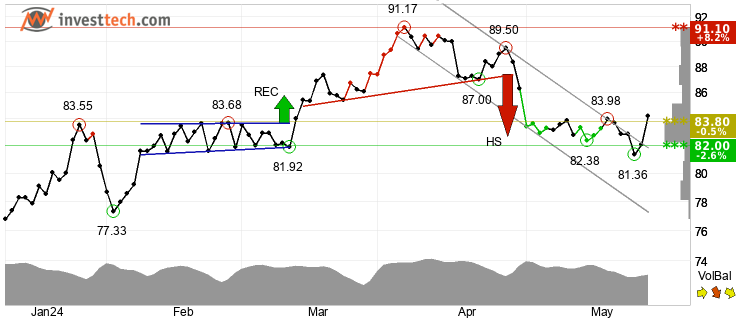
Korte termijn
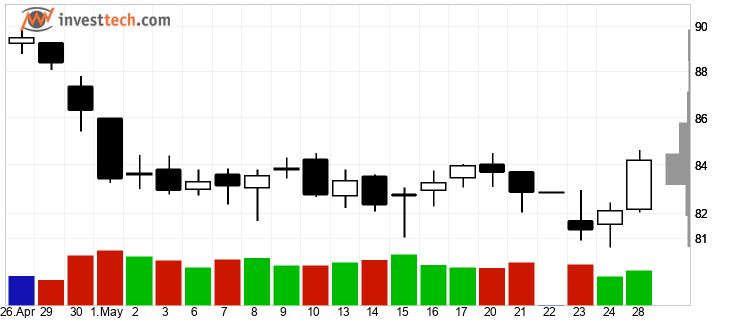
Brent Crude NYMEX heeft de stijgende trend verbroken, wat in eerste instantie een minder snelle stijging voorspelt. Gaf een verkoopsignaal van een kop-schouder patroon bij de doorbraak van de steun bij 87.39. Dit voorspelt een verdere daling tot 82.64 of lager. De future ligt tussen de steun bij 82.00 en de weerstand bij 83.60 . Een bevestigde doorbraak van een van deze niveaus geeft de nieuwe richting aan. De RSI is oversold, toch kan het aandeel blijven dalen. Pas als de RSI weer stijgt is dit een koopsignaal. De future is totaal gezien technisch licht negatief voor de korte termijn.Aanbeveling van een tot zes weken: Zwakke verkoop (Score: -42)
Automatische technische analyse. Middellang
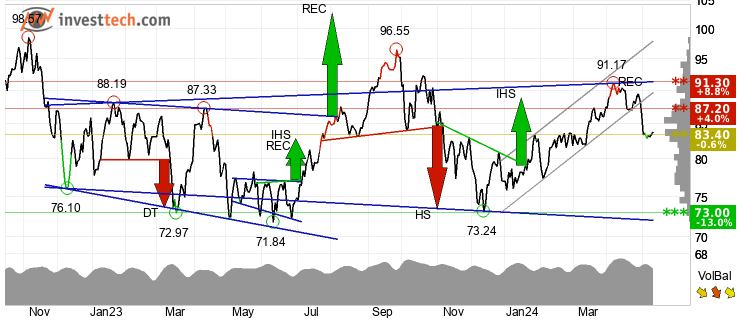
Middellange termijn
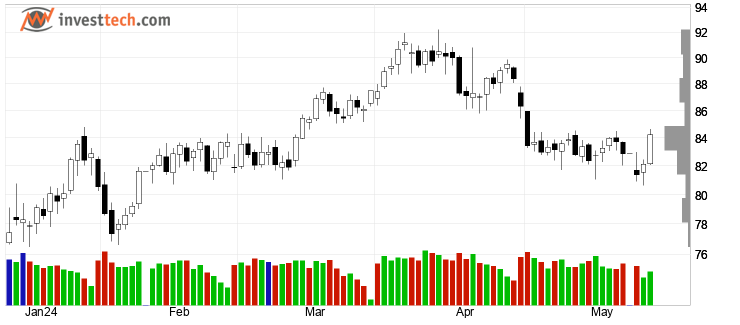
Brent Crude NYMEX heeft de stijgende trend verbroken, wat in eerste instantie een minder snelle stijging voorspelt. Zit in een rechthoekpatroon tussen de steun op 72.12 en de weerstand op 91.37. Een definitieve doorbraak van een van deze niveaus geeft de nieuwe richting van de koers aan. De future heeft marginaal de steun verbroken bij 83.40 . Een definitieve doorbraak voorspelt een verdere daling. Volumetoppen komen overeen met koersbodems en volumebodems komen overeen met koerstoppen. Dit verzwakt de future. De RSI is oversold, toch kan het aandeel blijven dalen. Pas als de RSI weer stijgt is dit een koopsignaal. De RSI-curve laat een dalende trend zien, dit kan een vroeg signaal zijn voor het begin van een dalende trend van de koers. De future is totaal gezien technisch negatief voor de middellange termijn.Aanbeveling van een tot zes maanden: Verkoop (Score: -57)
Automatische technische analyse. Lang
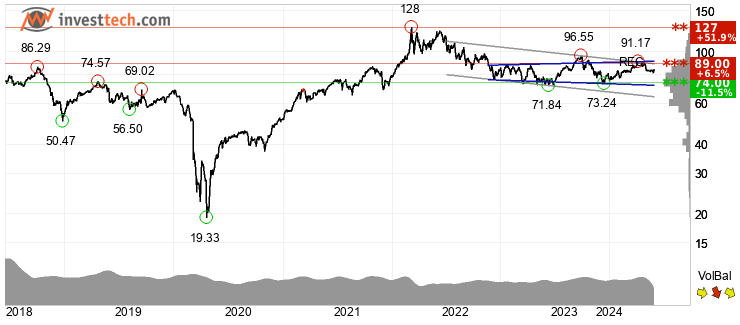
Lange termijn
Brent Crude NYMEX laat een zwakke ontwikkeling zien binnen een dalend trendkanaal. Geeft een negatieve koersontwikkeling aan en er ligt weerstand bij de bovenkant van het trendkanaal. Zit in een rechthoekpatroon tussen de steun op 72.12 en de weerstand op 91.37. Een definitieve doorbraak van een van deze niveaus geeft de nieuwe richting van de koers aan. De future ligt tussen de steun bij 74.00 en de weerstand bij 97.00 . Een bevestigde doorbraak van een van deze niveaus geeft de nieuwe richting aan. De future is totaal gezien technisch negatief voor de lange termijn.Aanbeveling van een tot zes kwartalen: Verkoop (Score: -52)
Volledige geschiedenis
Candlesticks 95 days
Candlesticks 22 days
Seizoenvariaties
Data niet gevondenEarly warning
| Slotkoersen volgende dag die indien verbroken een signaal geven |  | |
|---|---|---|
| Indicator | Koers | Koersdoel |
| Hoge RSI | 108.89 | - |
| Rechthoekpatroon | 91.37 | 110.31 |
| Rechthoekpatroon | 91.37 | 110.31 |
| Korte Termijn Trading Range | 89.50 | - |
| Lage RSI | 83.58 | - |
| Last close | 82.96 | - |
| Lange Termijn Trading Range | 75.89 | - |
| Indicator: | Type koop- of verkoopsignaal | |
| Koers: | Indien de slotkoers deze waarde de volgende dag verbreekt, wordt een signaal gegeven | |
| Koersdoel: | Koersdoel voor koop/verkoop signalen (alleen aangegeven voor patronen) | |
Alarmen
| Datum | Koers | Signal | Tijdshorizon | Koersdoel |
|---|---|---|---|---|
| 30 apr. 2024 | 86.33 | Kop-schouderpatroon | Kort | 82.64 |
| 30 apr. 2024 | 86.33 | Korte Termijn Trading Range | Middellang | -1.00 |
Key ratios
Data niet gevondenOver de analyses - Research shows the importance of Trend, Momentum and Volume
Investtechs analyses focus on a stocks trend status, short term momentum and volume development. These are central topics of technical analysis theory that describe changes in investor optimism or fluctuations in a companys financial development. However, Investtechs strong focus on these elements is due to research results that clearly indicate causation between these factors and future return on the stock market.
Trend

Theory: Stocks in rising trends will continue to rise.
Psychology/economy: Rising trends indicate that the company experiences positive development and increasing buy interest among investors. Read more
Research: Stocks in rising trend channels in Investtechs medium long term charts have been followed by an annualized excess return of 7.8 percentage points compared to average benchmark development. This is shown by Investtechs research into 34,880 cases of stocks in rising trends on the Nordic Stock Exchanges in the period 1996 to 2015.
Read more about the research results here
Momentum

Theory: Stocks with rising short term momentum will continue to rise. Stocks with very strong momentum (overbought) will react backwards.
Psychology/economy: RSI above 70 shows strong positive momentum. The stock has risen in the short term without any significant reactions downwards. Investors have kept paying more to buy stocks. This indicates that more investors want to buy the stock and that the price will continue to rise. Read more
Research: Stocks with strong momentum have on average continued to rise, and more so than the average stock listed on the Exchange. This is shown by Investtechs research into 24,208 cases of stocks on the Nordic Stock Exchanges in the period 1996 to 2015 where RSI went above 70 points, indicating strong and increasing short term momentum. On average, annualized, the stocks rose the equivalent of 11.4 percentage points more than the average stock.
Read the research report here
Volume

Theory: Rising prices on high volume and falling prices on low volume indicate strength in a stock. Volume can confirm a rising trend or signal that a falling trend is ending.
Psychology/economy: When investors very much want to buy a stock, they have to increase the price to find new sellers. Rising price on high volume shows that some investors are so aggressive that they push the price up to be able to buy the stock. Investtechs Volume Balance tool measures the relation between price rise and volume and measures investor aggression at rising and falling prices. Read more
Research: Stocks with volume balance above 40 have been followed by an average annual return of 4.7 percentage points on the Nordic Stock Exchanges, shown by research conducted by Investtech into 24,580 cases.
Read the research report here
Investtech's analyses
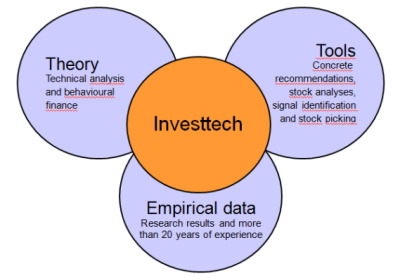
Investtech has combined theory, psychology and research into powerful investment tools.
Over Investtech
Investtech is specialist in behavioral finance en kwantitatieve analyses van beursgenoteerde aandelen. Het bedrijf verkoopt producten gericht op particuliere, professionele en institutionele beleggers. Investtech is beheerder van het AIFM-bedrijf Investtech Invest, wat kapitaal van klanten belegt in de aandelenmarkt.
Investtechs computers analyseren dagelijks meer dan 28.000 aandelen verdeeld over 12 landen. De analyses worden gepresenteerd in acht talen en worden verkocht aan klanten over de hele wereld. Behalve de automatische analyses, produceren de analisten van het bedrijf ook subjectieve aanbevelingen voor enkele markten. De analyses worden klanten aangeboden in de vorm van dagelijkse ochtendrapporten en cases, en wekelijkse market updates en modelportefeuilles.
Investtechs algoritmes voor analyse, rangschikking en aanbeveling van aandelen is gebaseerd op research sinds 1993. Delen van de research zijn uitgevoerd in samenwerking met de universiteit in Oslo en de Noorse onderzoeksraad. Research is nog steeds een hoge prioriteit voor Investtech. Veel van de resultaten van de research is beschikbaar voor Investtechs klanten via de website.
De standaardproducten van het bedrijf kosten vanaf ongeveer 30 euro per maand. Investtech levert ook op maat gemaakte producten ter intregratie op partnerwebsites of nieuwsbrieven, bijvoorbeeld van aandelenmakelaars og media. Neem contact op met info@investtech.com of bel ons op +47 21 555 888 voor meer informatie. Particulieren die niet eerder klant zijn geweest, kunnen zich registreren voor een gratis proefabonnement op onze website www.investtech.com.

Hoofdkantoor
Investtech ASStrandveien 17
1366 Lysaker
+47 21 555 888
Postadres
Investtech ASStrandveien 17
1366 Lysaker
info@investtech.com
Org.nr. 978 655 424 MVA
Onderzoeksafdeling
Instituttveien 102007 Kjeller
www.investtech.com
Beleggerpsychologie - Behavioral finance - Kwantitatieve analyse - Onderzoeksgebaseerde methoden
Technische analyse - Insider trades - Seizoenvariaties -Intradaghandel
Investeringsaanbevelingen worden gedaan door Investtech.com AS ("Investtech"). Investtech garandeert geen volledigheid of juistheid van de analyses. Eventuele fouten in de aanbevelingen, koop- en verkoopsignalen en mogelijke negatieve gevolgen hiervan zijn geheel het risico van de belegger. Investtech neemt geen enkele verantwoordelijkheid voor verlies, direct of indirect, als gevolg van het gebruik van Investtechs analyses. Meer informatie omtrent Investtechs analyses kunt u vinden op disclaimer.
Investeringsaanbevelingen worden gedaan door Investtech.com AS ("Investtech"). Investtech garandeert geen volledigheid of juistheid van de analyses. Eventuele fouten in de aanbevelingen, koop- en verkoopsignalen en mogelijke negatieve gevolgen hiervan zijn geheel het risico van de belegger. Investtech neemt geen enkele verantwoordelijkheid voor verlies, direct of indirect, als gevolg van het gebruik van Investtechs analyses. Meer informatie omtrent Investtechs analyses kunt u vinden op disclaimer.
Hoofdkantoor
Strandveien 171366 Lysaker, Norway
Research-afdeling
Instituttveien 102007 Kjeller, Norway
×
