try to get document id 44507
try to get document id 44507
try to get document id 44507
Investtech Research: Trend signals better than theory suggests
Published 20 June, 2019
Rising trends indicate that the company experiences positive development and increasing buy interest among investors. Technical analysis theory says that when the price is near resistance at the trend channel ceiling, there is considerable downside to the channel floor and the stock may fall in the short term. However, a new research report from Investtech based on 23 years of data from the Nordic markets shows increased excess return the higher the stock's position in the trend channel.
The trend is one of the most important indicators of technical analysis. According to technical analysis theory, stocks that are in rising trends will continue to rise, and stocks in falling trends will continue to fall. Previous research conducted by Investtech shows that this theory is correct.
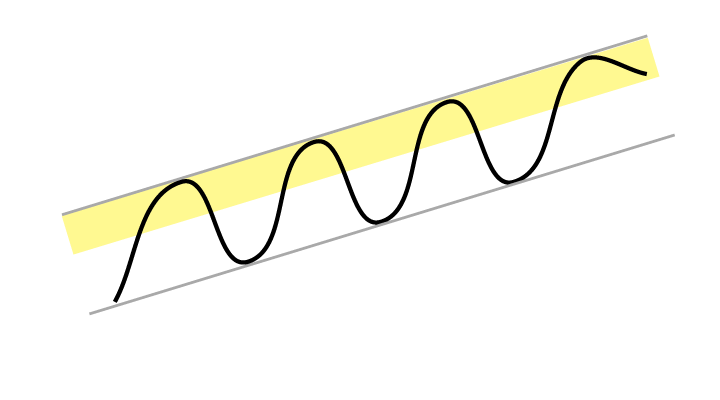 Traditional technical analysis theory also says that stocks in a rising trend will continue upwards within the trend. This implies that the price, when it approaches the trend channel ceiling, will fall and then rise again when it is close to the trend channel floor. We wanted to use historical data to test this theory.
Thus we studied the development of stocks listed on the stock exchanges in Norway, Sweden, Denmark and Finland since 1996, 2003, 2005 and 2007, respectively, until the end of 2018. A total of 101,763 cases were identified where a stock had a rising trend in the medium long term. In these trend channels we studied return as a function of positional value, i.e. the price's position along the vertical height of the trend channel.
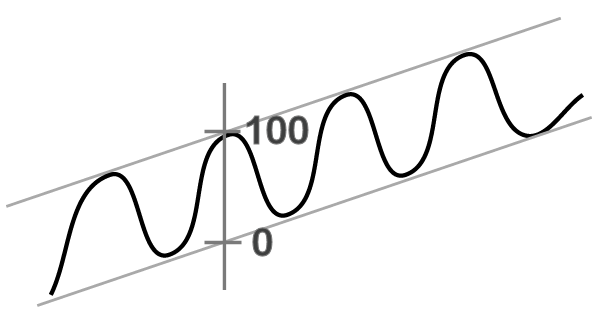 The positional value ranges from 0 (at the trend channel floor) to 100 (at the trend channel ceiling). We also included cases where the price was below the floor of the trend channel, i.e. positional value below 0, and above the trend ceiling, i.e. positional value above 100.
The chart below shows excess return after 1 month (22 business days) vs average benchmark development as a function of positional value for Norwegian stocks. Each column represents excess return after 22 days for the given interval of the vertical trend position. For example, the middle column shows that excess return after 22 days was 1.4 percentage points when the price on day 0 was between 40 and 60 per cent of the height of the trend channel. The black line is a regression line for excess return as a function of the positional value. The red line is average excess return for all stocks in rising trend. The figures in parentheses at the bottom show number of cases in each interval.
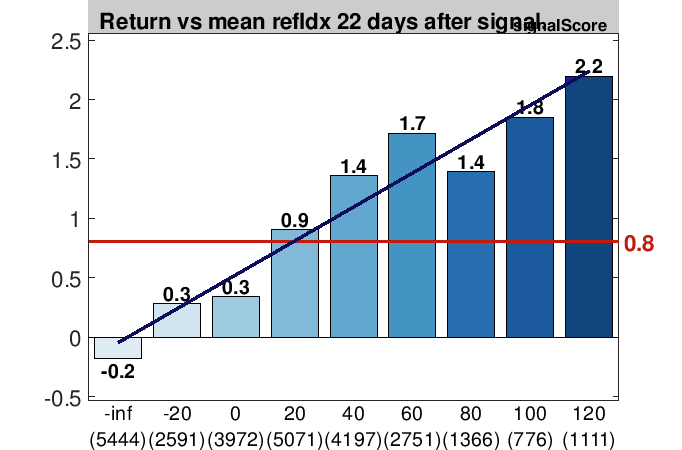
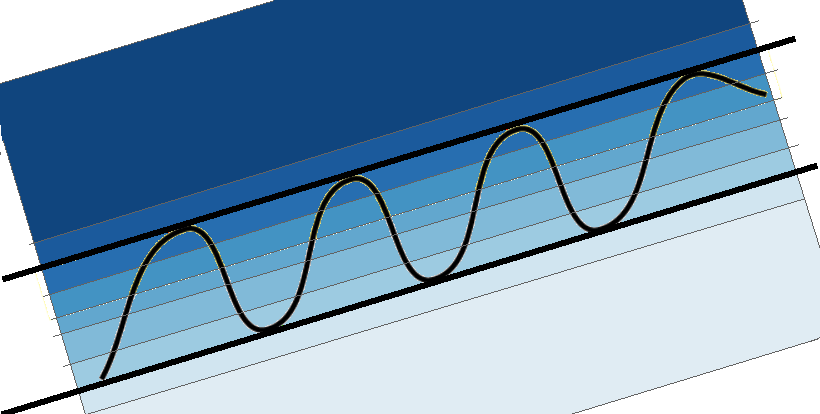
Figure 1: Norway, excess return after 22 days. The shade of blue indicates the connection between trend channel position and return in the following 22 days.
In Norway, stocks from the middle of the trend up to the trend ceiling had an excess return of approximately 1.6 percentage points, i.e. significantly better than stocks lower in the trend.
Stocks that had broken upwards through the trend ceiling, with trend position above 100, have continued rising with significant excess return. The regression line shows that excess return clearly increases when the price's position is higher in the trend channel.
More details and results are available in the research report here >>
Keywords: h_TR.
Skrevet av

Seniorforsker & analytiker
i Investtech
Investeringsanbefalingen(e) er utarbeidet av Investtech.com AS ("Investtech"). Investtech garanterer ikke fullstendigheten eller riktigheten av analysen. Eventuell eksponering i henhold til rådene / signalene som fremkommer i analysene står fullt og helt for investors regning og risiko. Investtech er ikke ansvarlig for noe tap, verken direkte eller indirekte, som oppstår som en følge av bruk av Investtechs analyser. Opplysninger om eventuelle interessekonflikter vil alltid fremgå av investeringsanbefalingen. Ytterligere informasjon om Investtechs analyser finnes på informasjonssiden.
Investeringsanbefalingen(e) er utarbeidet av Investtech.com AS ("Investtech"). Investtech garanterer ikke fullstendigheten eller riktigheten av analysen. Eventuell eksponering i henhold til rådene / signalene som fremkommer i analysene står fullt og helt for investors regning og risiko. Investtech er ikke ansvarlig for noe tap, verken direkte eller indirekte, som oppstår som en følge av bruk av Investtechs analyser. Opplysninger om eventuelle interessekonflikter vil alltid fremgå av investeringsanbefalingen. Ytterligere informasjon om Investtechs analyser finnes på informasjonssiden.


 Oslo Børs
 Stockholmsbörsen
 Københavns Fondsbørs
 Helsingin pörssi
 World Indices
 US Stocks
 Toronto Stock Exchange
 London Stock Exchange
 Euronext Amsterdam
 Euronext Brussel
 DAX
DAX CAC 40
 Mumbai S.E.
 Commodities
 Currency
 Cryptocurrency
 Exchange Traded Funds
 Investtech Indices