
 Oslo Børs
 Stockholmsbörsen
 Københavns Fondsbørs
Investeringsforeninger
Københavns Fondsbørs
Investeringsforeninger
 Helsingin pörssi
 World Indices
 US Stocks
US 30
Nasdaq 100
US 500
US Stocks
US 30
Nasdaq 100
US 500
 Toronto Stock Exchange
 London Stock Exchange
 Euronext Amsterdam
 Euronext Brussel
 DAX
SDAX
TECDAX
Frankfurt
CDAX
MDAX
Prime Standard
DAX
SDAX
TECDAX
Frankfurt
CDAX
MDAX
Prime Standard
 CAC 40
 Mumbai S.E.
National S.E.
Mumbai S.E.
National S.E.
 Commodities
 Currency
 Cryptocurrency
 Exchange Traded Funds
 Investtech Indices
Technical analysis: The Oil Sector
Published 2016-06-10
This week we have looked at crude oil and some of the larger international companies in the oil sector.
Several of the stocks show short term positive trends after the price of crude oil hit a bottom in January. We take a look at what the technical picture says about the development of the oil sector.
Royal Dutch Shell A (RDSA)
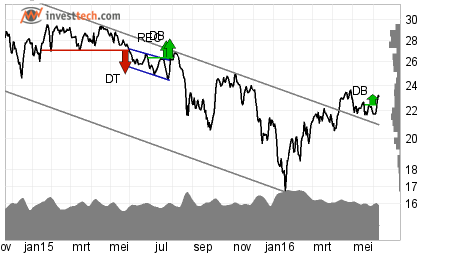 Royal Dutch Shell-A has seen strong development since mid January and broke upwards through the ceiling of a falling trend, which indicates a sideways development to come.
The stock also triggered a buy signal from a double bottom formation after the break up through approx. 22.50 euro, which signals continued rise.
However, there are several resistance levels above todays price, between 24.80-29.50 euro, which indicates that there are sellers at these levels who may be tempted to cash in the profit from this years price increase. This can cause reactions downwards. However, continued rise and a break up through the higher level will signal future positive development.
Except for the support at 20.60 euro, there is little support in the medium term and todays price can be a good exit price in terms of risk reward.
Investtechs recommendation: Weak Negative Candidate
Crude Oil Light Sweet (CL)
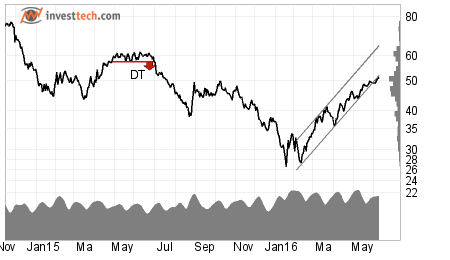 Crude Oil Light Sweet has reversed a negative development, after hitting 26.55 USD in late January, and is in a rising trend in the medium long term. Continued positive development within the trend is indicated.
Previous resistance at 38-50 USD is broken, which signals continued rise. There is little resistance towards the ceiling of the trend channel at approx. 61-62 USD, which gives an upside of just above 20 per cent from the closing price of June 8. At the same time there is support at 38-50 USD which can limit the downside, and todays price may be a good entry price in terms of risk reward.
Prices above resistance at approx. 61-62 USD, in the shape of horizontal resistance and the ceiling of the trend channel, have not been seen since December 2014 and may again cause reactions down. On the other hand, a break will be a good signal of continued positive development, and we need to look at the long term chart to find strong resistance at 77 USD. The correlation between the price development of crude oil and the oil sector stocks makes these levels worth taking into consideration when trading these stocks.
The rising trend is strengthened by positive volume balance, which means that the price rises on high volume and falls on low volume, as well as high momentum which indicates that more and more investors are positive and believe in continued rise.
Investtechs recommendation: Weak Positive Candidate
Sinopec Corp. (0386)
 Sinopec Corp. is in a falling trend in the long term, which indicates that more and more investors become negative and reduce prices in order to get out of the stock. Continued weak development is indicated.
However, the stock shows strength via rising trends in shorter time perspectives, i.e. short to medium long term.
In the medium long term there is horizontal resistance near a previous top from last October, at approx. 5.80 HKD. A break upwards through this level will mean little resistance in the short to medium long term and will signal further rise in these time perspectives.
However, this years rise has resulted in the price approaching long term strong resistance between 6-7.60 HKD in the shape of horizontal resistance and the ceiling of the falling trend channel. These indicate that there are sellers at these levels who may be tempted to cash out their profits, which can give a reaction down.
Even though the stock is positive in the shorter intervals, the long term resistance levels are solid and there are better alternatives. We should see a break up through resistance at 7.60 HKD in order for the long term technical picture to indicate further rise as well.
Investtechs recommendation: Weak Negative Candidate
BP (BP)
 BP is in a falling trend in the long term, which indicates continued weak development. However, a short term rising trend is a sign of strength and the break up through the ceiling of a falling trend in the medium long term indicates coming sideways development.
After the stock broke through previous long term resistance at 373 GBp this week, there is now support between 322-373 GBp, which may limit the downside. Resistance is at approx. 403-484 GBp in the medium long to long term.
The rise of the past few days and the break up through 366-373 GBp happened in combination with declining volume, which is a signal of weakness, and the stock is weakened by negative volume balance.
Investtechs recommendation: Neutral
Exxon Mobile Corp. (XOM)
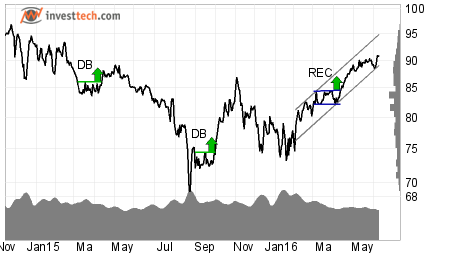 Similar to Crude Oil, Exxon Mobil Corp. has developed favourably this year and is in a rising trend in the medium long term which indicates that buy interest among investors is increasing. Continued positive development is indicated.
Several previous resistance levels between approx. 83.80-89 USD have been broken and the break upwards through approx. 85 USD triggered a buy signal from a smaller rectangle formation in the medium long term and from a head and shoulders formation in the long term, which indicates that the stock may enter a rising trend in this time perspective as well.
On Tuesday the stock broke up above a previous top at 89.11 USD from last May and we have to go back another three months to see the stock at these same levels. There is little resistance in the medium term which indicates that the upside is good. At the same time, support at 83.80-87 USD can limit the downside.
In the long term the stock is in a horizontal trend and there is resistance between 93-104 USD, which indicates that there are sellers at these levels who may limit the upside. However, a break upwards through this level will be a strong signal of positive development to come.
Todays price may be a good entry price in terms of risk reward. Stop loss can be set at a closing price below support at 83.80 USD in order to limit the downside.
Investtechs recommendation: Positive Candidate
The analyses are based on closing prices from Wednesday June 8.
Skrevet av

Analytiker
i Investtech
"Investtech analyserer psykologien i markedet og gir deg konkrete tradingforslag hver dag."

Partner & Senior Advisor - Investtech


Investeringsanbefalingen(e) er utarbeidet av Investtech.com AS ("Investtech"). Investtech garanterer ikke fullstendigheten eller riktigheten av analysen. Eventuell eksponering i henhold til rådene / signalene som fremkommer i analysene står fullt og helt for investors regning og risiko. Investtech er ikke ansvarlig for noe tap, verken direkte eller indirekte, som oppstår som en følge av bruk av Investtechs analyser. Opplysninger om eventuelle interessekonflikter vil alltid fremgå av investeringsanbefalingen. Ytterligere informasjon om Investtechs analyser finnes på informasjonssiden.
Investeringsanbefalingen(e) er utarbeidet av Investtech.com AS ("Investtech"). Investtech garanterer ikke fullstendigheten eller riktigheten av analysen. Eventuell eksponering i henhold til rådene / signalene som fremkommer i analysene står fullt og helt for investors regning og risiko. Investtech er ikke ansvarlig for noe tap, verken direkte eller indirekte, som oppstår som en følge av bruk av Investtechs analyser. Opplysninger om eventuelle interessekonflikter vil alltid fremgå av investeringsanbefalingen. Ytterligere informasjon om Investtechs analyser finnes på informasjonssiden.
Copyright Ⓒ 1997-2024 Investtech.com AS, Org nr 978 655 424 MVA Personvernerklæring | Ansvarsfraskrivelse
Hovedkontor
Strandveien 171366 Lysaker, Norway
Forskningsavdeling
Instituttveien 102007 Kjeller, Norway