
 Oslo Børs
 Stockholmsbörsen
 Københavns Fondsbørs
Investeringsforeninger
Københavns Fondsbørs
Investeringsforeninger
 Helsingin pörssi
 World Indices
 US Stocks
US 30
Nasdaq 100
US 500
US Stocks
US 30
Nasdaq 100
US 500
 Toronto Stock Exchange
 London Stock Exchange
 Euronext Amsterdam
 Euronext Brussel
 DAX
SDAX
TECDAX
CDAX
MDAX
Prime Standard
DAX
SDAX
TECDAX
CDAX
MDAX
Prime Standard
 CAC 40
 Mumbai S.E.
National S.E.
Mumbai S.E.
National S.E.
 Commodities
 Currency
 Cryptocurrency
 Exchange Traded Funds
 Investtech Indices
OMX Copenhagen 25 GI (OMXC25GI.CO)
Close: 1 898.03 (+5.10), Apr 25, 2025
Weak Negative
Low risk
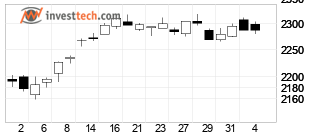
Candlesticks
Short term: Weak Negative
Medium term: Negative
Long term: Positive


Short term
OMX Copenhagen 25 GI is in a falling trend channel in the short term. This shows that investors over time have sold at lower prices to get out of the index, and indicates negative development for the market. The index has support at points 1710 and resistance at points 2035. The index is assessed as technically slightly negative for the short term.Recommendation one to six weeks: Weak Negative (Score: -39)
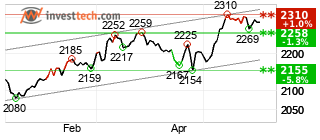
Medium term
OMX Copenhagen 25 GI has broken down through the floor of the falling trend channel in the medium long term, which signals an even stronger falling rate. The negative development, however, may give rise to short term corrections up from today's level. There is no support in the price chart and further decline is indicated. In case of a positive reaction, the index has resistance at 2030 points. The index is assessed as technically negative for the medium long term.Recommendation one to six months: Negative (Score: -91)
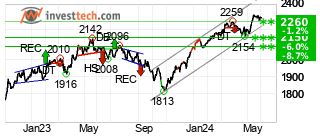
Long term
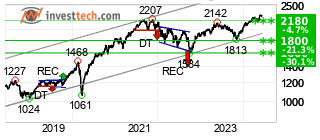
OMX Copenhagen 25 GI is within an approximate horizontal trend channel in the long term. This indicates that investors are uncertain and waiting for signals of further direction. A break upwards will be a positive signal, while a break downwards will be a negative signal. The index has broken up through resistance at points 1800. This predicts a further rise. The index is assessed as technically positive for the long term.Recommendation one to six quarters: Positive (Score: 72)
Overall analysis
OMX Copenhagen 25 GI is technically negative for the short and medium term, but positive for the long term. The index is neutral on Insider Trades.Recommendation one to six months: Weak Negative (Score: -32)
Investtech guarantees neither the entirety nor accuracy of the analyses. Any consequent exposure related to the advice / signals which emerge in the analyses is completely and entirely at the investors own expense and risk. Investtech is not responsible for any loss, either directly or indirectly, which arises as a result of the use of Investtechs analyses. Details of any arising conflicts of interest will always appear in the investment recommendations. Further information about Investtechs analyses can be found here disclaimer.
The content provided by Investtech.com is NOT SEC or FSA regulated and is therefore not intended for US or UK consumers.
Copyright Ⓒ 1997-2025 Investtech.com AS, Org nr 978 655 424 MVA Privacy Policy | Disclaimer | Sustainability Strategy
Head office
Strandveien 171366 Lysaker, Norway
Research department
Instituttveien 102007 Kjeller, Norway
×
