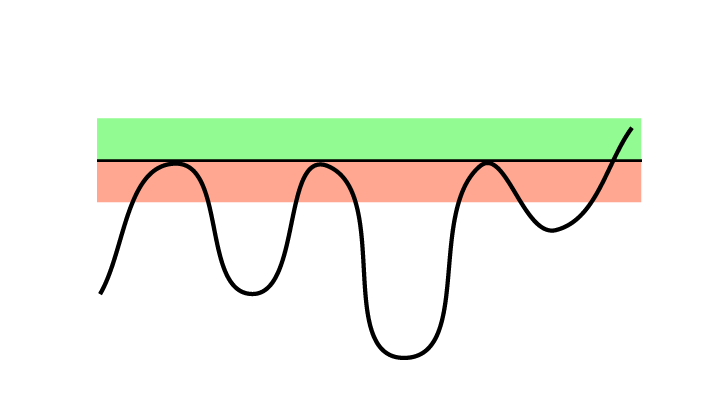
Support and Resistance: Break upwards through resistance is a buy signal
Published 24 October 2019
Stocks that have broken upwards through resistance have continued to rise and have outperformed benchmark. These signals may be valuable input in a decision of whether to buy the stock. When monitoring a stock in terms of potential purchase, the period after a break upwards through resistance will statistically be a good time to buy. This is in agreement with classic technical analysis theory.
According to technical analysis theory, support and resistance are among the most central concepts in technical analysis and can in theory be used to find good buy and sell levels.
 Figure 1: A break upwards through resistance is a buy signal. This is especially true if volume is also increasing. The sellers who used to be at this level are gone, but there is still buy pressure in the stock.
In theory, a stock that recently broke through a resistance level is expected to continue rising. Buying such stocks allows the investor to enter the stock early in a rising phase. If the stock has risen significantly since the break, a better price can be achieved by waiting for a reaction back.
Please note that stocks in falling trends often give false buy signals on breaks upwards through resistance. When buying such stocks, a long term and strong resistance level should be broken, and the break should be accompanied by increasing volume and positive volume development.
Research results
We have studied return from Norwegian, Swedish, Danish and Finnish stocks following signals triggered by stocks' movements in relation to support and resistance levels in technical price charts. We used support and resistance levels automatically identified in Investtech’s medium term price charts. We had 23 years of data, from 1996 to 2018.
The chart below shows average price development following buy signals from stocks breaking upwards through support identified in Investtech’s medium term price charts. The signals are triggered on day 0. Only days when the exchange is open are included, so 66 days equal approximately three months. The thick blue line shows the development of buy signal stocks. The shaded areas are the standard deviation of the calculations. The thin blue line shows benchmark development in the same period as the buy signal stocks.
Figure 2: Return following buy signals from stocks with break upwards through support identified in Investtech’s medium term price charts. Thick blue line is buy signals, thin blue line is benchmark, the Nordic markets, 1996-2018.
| Annualised return (based on 66-day figures) | Norway | Sweden | Denmark | Finland | Weighted average |
| Buy signal | 18.2 % | 16.8 % | 16.8 % | 9.4 % | 16.3 % |
| Benchmark in same period | 12.0 % | 12.3 % | 10.3 % | 5.3 % | 11.2 % |
| Excess return buy signal | 6.1 pp | 4.5 pp | 6.4 pp | 4.1 pp | 5.1 pp |
pp = percentage point
Stocks with buy signal following break upwards through resistance have risen in the following period. The rise in the first three months after signals was on average 4.0 per cent for 43,367 signals from the Nordic markets combined. This is an excess return of 1.2 percentage points compared to benchmark in the same period. Annualised return was 5.1 percentage points.
Statistical t-value is as high as 11.1 for the 66-day figures and suggests statistically significant positive deviation from benchmark development. An excess return of 1.2 percentage points in three months indicates that such signals can be valuable input in an active trading strategy, also when taking commission and other trading costs into account.
Article on sell signals:
Support and Resistance: Break downwards through support is a sell signal
Read the research report here.
Verfasst von

Forschungs- und Analysechef
Investtech
Research articles:
Support and Resistance: Research results cause doubt about buy signals
Support and Resistance: Profitable to buy stocks that are near resistance
Support and Resistance: Break upwards through resistance is a buy signal
Support and Resistance: Break downwards through support is a sell signal
Support and Resistance: Buy signal when stock is above support and lacks resistance
Support and Resistance: Good sell signals from stocks that are far below resistance and lack support
Please note:
Changes to Support and Resistance algorithms
Insight & Skills:
Die Anlageempfehlungen werden von Investtech.com AS ("Investtech") ausgearbeitet. Investtech übernimmt keine Haftung für die Vollständigkeit oder Richtigkeit der jeweiligen Analyse. Ein etwaiges Engagement aufgrund der aus den Analysen resultierenden Empfehlungen/Signale erfolgt zur Gänze für Rechnung und Risiko des Anlegers. Investtech haftet nicht für Verluste, die sich direkt oder indirekt infolge der Nutzung von Investtechs Analysen ergeben. Angaben zu etwaigen Interessenkonflikten gehen stets aus der Anlageempfehlung hervor. Weitere Informationen zu Investtechs Analysen finden Sie unter disclaimer.
Die Anlageempfehlungen werden von Investtech.com AS ("Investtech") ausgearbeitet. Investtech übernimmt keine Haftung für die Vollständigkeit oder Richtigkeit der jeweiligen Analyse. Ein etwaiges Engagement aufgrund der aus den Analysen resultierenden Empfehlungen/Signale erfolgt zur Gänze für Rechnung und Risiko des Anlegers. Investtech haftet nicht für Verluste, die sich direkt oder indirekt infolge der Nutzung von Investtechs Analysen ergeben. Angaben zu etwaigen Interessenkonflikten gehen stets aus der Anlageempfehlung hervor. Weitere Informationen zu Investtechs Analysen finden Sie unter disclaimer.


 Oslo Børs
 Stockholmsbörsen
 Københavns Fondsbørs
 Helsingin pörssi
 World Indices
 US Stocks
 Toronto Stock Exchange
 London Stock Exchange
 Euronext Amsterdam
 Euronext Brussel
 DAX
DAX CAC 40
 Mumbai S.E.
 Commodities
 Currency
 Cryptocurrency
 Exchange Traded Funds
 Investtech Indices


