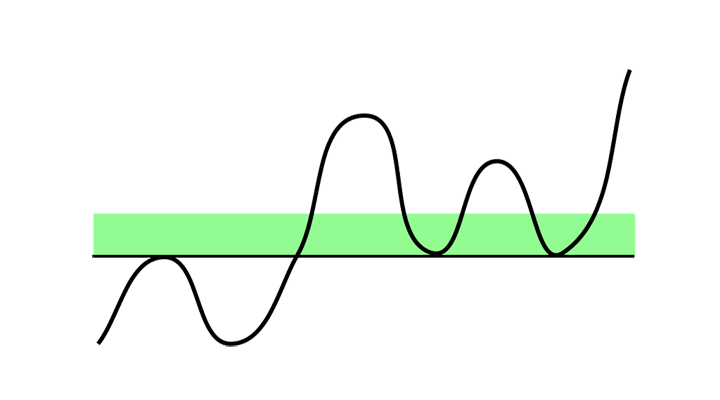
Support and Resistance: Buy signal when stock is above support and lacks resistance
Published 26 September 2019
Stocks that are far above support and lack resistance have risen a great deal in the following period. Despite these being considered theoretically neutral situations, our research results show that statistically they are very good buy signals.
According to technical analysis theory, support and resistance are among the most central concepts in technical analysis and can in theory be used to find good buy and sell prices.
 Figure 1: The price is above a support level, where the stock has previously turned upwards. Many investors may consider it cheap if it falls towards support again, and may then wish to buy.
Support is where many buyers are thought to become active. It is normally assumed that the stock will not fall below support. Support is thus often used to calculate the downside potential in the stock, especially for short term investors. A stock with a long way down to support has a bigger downside than a stock near support.
Especially in rising and horizontal trends, support expresses the downside potential in the stock. If, at the same time, there is little to no resistance above the current price, the upside potential tends to be high
Research results
We have studied return from Norwegian, Swedish, Danish and Finnish stocks following signals triggered by stocks' movements in relation to support and resistance levels in technical price charts. We used support and resistance levels automatically identified in Investtech’s medium term price charts. We had 23 years of data, from 1996 to 2018.
The chart below shows average price development following buy signals from stocks far above support and lacking resistance in Investtech’s medium term price charts. The signals are triggered on day 0. Only days when the exchange is open are included, so 66 days equal approximately three months. The thick blue line shows the development of buy signal stocks. The shaded areas are the standard deviation of the calculations. The thin blue line shows benchmark development in the same period as the buy signal stocks.
Figure 2: Return following buy signals from stocks that are far above support and lack resistance identified in Investtech’s medium term price charts. The thick blue line is signal stocks, thin blue line is benchmark, the Nordic markets, 1996-2018.
| Annualised return (based on 66-day figures) | Norway | Sweden | Denmark | Finland | Weighted average |
| Buy signal | 28.3 % | 23.4 % | 25.7 % | 15.6 % | 24.4 % |
| Benchmark in same period | 13.5 % | 12.9 % | 11.3 % | 7.3 % | 12.4 % |
| Excess return buy signal | 14.7 pp | 10.5 pp | 14.4 pp | 8.4 pp | 12.0 pp |
Stocks with buy signals from being above support and lacking resistance have risen in the following period. The rise in the first three months after signals was on average 5.9 per cent for 44,463 signals from the Nordic markets combined. This equals an excess return of 2.8 percentage points vs benchmark in the same period. Annualised excess return was 12.0 percentage points.
Statistical t-value is a high 24.9 for 66-day figures, suggesting significant positive deviation from benchmark development. Excess return of 2.8 percentage points in three months indicates that these signals can be valuable input into an active trading strategy also taking into account commission and other trading costs.
Article on sell signals:
Support and Resistance: Good sell signals from stocks that are far below resistance and lack support
Read more in the research report here.
Keywords: h_Res,h_Sup.
Verfasst von

Forschungs- und Analysechef
Investtech
Research articles:
Support and Resistance: Research results cause doubt about buy signals
Support and Resistance: Profitable to buy stocks that are near resistance
Support and Resistance: Break upwards through resistance is a buy signal
Support and Resistance: Break downwards through support is a sell signal
Support and Resistance: Buy signal when stock is above support and lacks resistance
Support and Resistance: Good sell signals from stocks that are far below resistance and lack support
Further research articles will be published as soon as possible.
Please note:
Changes to Support and Resistance algorithms
Insight & Skills:
"Investtech analysiert die Psychologie des Marktes und macht Ihnen täglich konkrete Tradingvorschläge."

Partner & Senior Advisor - Investtech
Die Anlageempfehlungen werden von Investtech.com AS ("Investtech") ausgearbeitet. Investtech übernimmt keine Haftung für die Vollständigkeit oder Richtigkeit der jeweiligen Analyse. Ein etwaiges Engagement aufgrund der aus den Analysen resultierenden Empfehlungen/Signale erfolgt zur Gänze für Rechnung und Risiko des Anlegers. Investtech haftet nicht für Verluste, die sich direkt oder indirekt infolge der Nutzung von Investtechs Analysen ergeben. Angaben zu etwaigen Interessenkonflikten gehen stets aus der Anlageempfehlung hervor. Weitere Informationen zu Investtechs Analysen finden Sie unter disclaimer.
Die Anlageempfehlungen werden von Investtech.com AS ("Investtech") ausgearbeitet. Investtech übernimmt keine Haftung für die Vollständigkeit oder Richtigkeit der jeweiligen Analyse. Ein etwaiges Engagement aufgrund der aus den Analysen resultierenden Empfehlungen/Signale erfolgt zur Gänze für Rechnung und Risiko des Anlegers. Investtech haftet nicht für Verluste, die sich direkt oder indirekt infolge der Nutzung von Investtechs Analysen ergeben. Angaben zu etwaigen Interessenkonflikten gehen stets aus der Anlageempfehlung hervor. Weitere Informationen zu Investtechs Analysen finden Sie unter disclaimer.


 Oslo Børs
 Stockholmsbörsen
 Københavns Fondsbørs
 Helsingin pörssi
 World Indices
 US Stocks
 Toronto Stock Exchange
 London Stock Exchange
 Euronext Amsterdam
 Euronext Brussel
 DAX
DAX CAC 40
 Mumbai S.E.
 Commodities
 Currency
 Cryptocurrency
 Exchange Traded Funds
 Investtech Indices


