Short term head and shoulders formations have low predictive power
Published 14 November 2017
Inverse/ head and shoulders formations in Investtech's short term charts have low predictive power. This is shown in a research report from Investtech based on 11 years of data from the Stockholm Stock Exchange in Sweden.
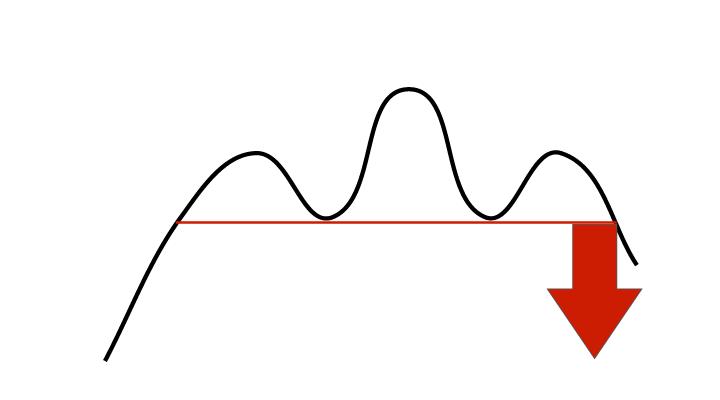
A head and shoulders formation is a top formation which marks the end of a rising period. The formation consists of a left shoulder, a head and a right shoulder, connected by a neckline, see figure 1. The creation of a head and shoulders formation indicates increasing pessimism among investors and the start of a falling trend. Such formations are considered among the most reliable signals in technical analysis. They are primarily used to predict reversals in long term market trends, but can also be used in the shorter term.
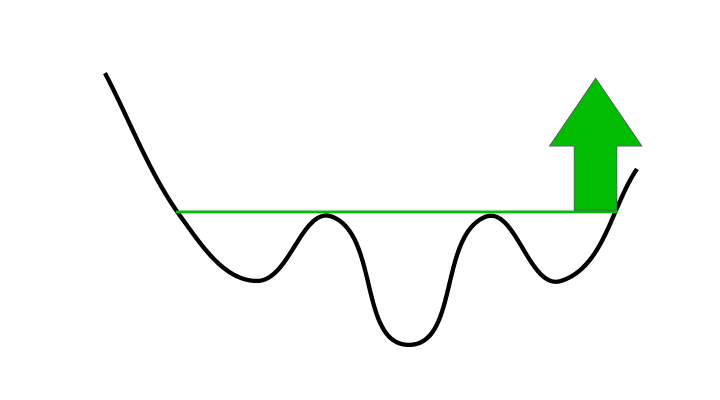
This formation also exists in the opposite direction, as an inverse head and shoulders formation, see figure 2. This is a bottom formation which marks the end of a falling period. An inverse head and shoulders formation signals increasing optimism among investors and the start of a rising trend.

Figure 1: Sell signal from head and shoulders formation.

Figure 2: Buy signal from inverse head and shoulders formation.
In technical analysis terminology we say that a break downwards through the neckline of a head and shoulders formation triggers a sell signal. Similarly a break up from an inverse head and shoulders formation triggers a buy signal.
We have studied the price movements following buy and sell signals from such formations on the Stockholm Stock Exchange in Sweden.
Investtech's computers identified a total of 863 buy signals and 1,037 sell signals in stocks on the Stockholm Stock Exchange in the period 2003 to 2014.

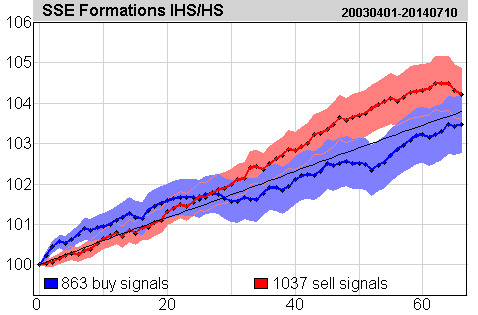
Figure 3: Price development after buy and sell signals from inverse/ head and shoulders formations on the Stockholm Stock Exchange identified by Investtech’s automatic algorithms in short term price charts. Click the image for bigger version.
The chart shows average price development following short term buy and sell signals from inverse/ head and shoulders formations. The signals are triggered on day 0. Only days when the exchange is open are included, so 66 days equal approximately three months. Buy signals are the blue line and sell signals are the red one. The shaded areas are the standard deviation of the calculations. Benchmark index is the black line.
Figure 3 shows that buy and sell signals both have been followed by price development in line with average benchmark development. There are some deviations, but they are not significant based on statistical t-value.
More details and results are available in the research report here (in Swedish).
Verfasst von

Forschungs- und Analysechef
Investtech
"Investtech analysiert die Psychologie des Marktes und macht Ihnen täglich konkrete Tradingvorschläge."

Partner & Senior Advisor - Investtech
Die Anlageempfehlungen werden von Investtech.com AS ("Investtech") ausgearbeitet. Investtech übernimmt keine Haftung für die Vollständigkeit oder Richtigkeit der jeweiligen Analyse. Ein etwaiges Engagement aufgrund der aus den Analysen resultierenden Empfehlungen/Signale erfolgt zur Gänze für Rechnung und Risiko des Anlegers. Investtech haftet nicht für Verluste, die sich direkt oder indirekt infolge der Nutzung von Investtechs Analysen ergeben. Angaben zu etwaigen Interessenkonflikten gehen stets aus der Anlageempfehlung hervor. Weitere Informationen zu Investtechs Analysen finden Sie unter disclaimer.
Die Anlageempfehlungen werden von Investtech.com AS ("Investtech") ausgearbeitet. Investtech übernimmt keine Haftung für die Vollständigkeit oder Richtigkeit der jeweiligen Analyse. Ein etwaiges Engagement aufgrund der aus den Analysen resultierenden Empfehlungen/Signale erfolgt zur Gänze für Rechnung und Risiko des Anlegers. Investtech haftet nicht für Verluste, die sich direkt oder indirekt infolge der Nutzung von Investtechs Analysen ergeben. Angaben zu etwaigen Interessenkonflikten gehen stets aus der Anlageempfehlung hervor. Weitere Informationen zu Investtechs Analysen finden Sie unter disclaimer.


 Oslo Børs
 Stockholmsbörsen
 Københavns Fondsbørs
 Helsingin pörssi
 World Indices
 US Stocks
 Toronto Stock Exchange
 London Stock Exchange
 Euronext Amsterdam
 Euronext Brussel
 DAX
DAX CAC 40
 Mumbai S.E.
 Commodities
 Currency
 Cryptocurrency
 Exchange Traded Funds
 Investtech Indices


