
 Oslo Børs
 Stockholmsbörsen
 Københavns Fondsbørs
Investeringsforeninger
Københavns Fondsbørs
Investeringsforeninger
 Helsingin pörssi
 World Indices
 US Stocks
US 30
Nasdaq 100
US 500
US Stocks
US 30
Nasdaq 100
US 500
 Toronto Stock Exchange
 London Stock Exchange
 Euronext Amsterdam
 Euronext Brussel
 DAX
SDAX
TECDAX
Frankfurt
CDAX
MDAX
Prime Standard
DAX
SDAX
TECDAX
Frankfurt
CDAX
MDAX
Prime Standard
 CAC 40
 Mumbai S.E.
National S.E.
Mumbai S.E.
National S.E.
 Commodities
 Currency
 Cryptocurrency
 Exchange Traded Funds
 Investtech Indices
Die Trendbibel
 Telefon: 08-517 29 555
 E-Mail senden
 Bitte um Rückruf
 Besuchen Sie uns

Make a portfolio with ten stocks. Buy and hold stocks in rising trends. Avoid very volatile stocks and replace stocks when they enter falling trends. Be aware that it takes time to achieve good statistical results.
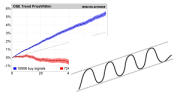
Trend-Based Investment Strategy
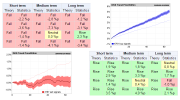
The study of 350,297 signals from trends in stocks in the Nordic stock exchanges in the period 1996 to 2016 gave the following results presumed to be statistically significant:
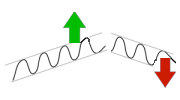
Stocks in rising trends or breaking upwards from rising or sideways trends give excess return compared to benchmark.
- Stocks in falling trends or breaking downwards from falling or sideways trends give negative excess return compared to benchmark.
- Stocks breaking downwards from rising trend give statistical return in line with benchmark.
- Signals from trend channels identified in Investtechs short and medium long term price charts have better predictive power than the long term price charts.
- The signals have better predictive power for stocks with medium high liquidity than for stocks with high liquidity, especially for the buy signals.
- The predictive power is stronger in the first one to two months, but good for up to half a year after signals.
First some general criteria for stock market investments, that also take into account the nature of our statistical results.
- Be long term and only invest in stocks if your investment perspective is five years or more. Fluctuations are great from year to year and investing short term gives a high risk of missing out on the excess return that the stock market statistically gives when compared to other investment possibilities.
- Do not attempt to time entry and exit from the market. Be invested all the time. Investtech has no statistics on the effect of trend signals for indices and markets, only for individual stocks.
- Make a portfolio of seven to fifteen stocks. This gives moderate distribution of risk while also a targeted enough portfolio with emphasis on the very best stocks. Also, such a small number of stocks will be easier to manage and follow up on a weekly basis.
- Articulate a strategy, based on documented statistical conditions, and make routines for how to carry out the strategy in practice.
- Stick to your strategy, also if in the first months or one to two years it does not show the good results you expected. Results can vary a lot over time, and only keeping a consistent strategy for a long time will approach annual long term statistical results.
A strategy must be adjusted to your personal premises and wishes in terms of risk tolerance, investment perspective, execution via (online) broker and trade frequency. Our starting point is medium large private investors with between 0.5 and 5 million Norwegian krone (NOK) in the market, who follows up the portfolio weekly and trades via an online broker in the daytime. Effective commission may be around 0.05 per cent, and at relatively passive execution trade prices could be near or a little better than volume weighted average. This allows fairly high trade frequency without negative impact on return possibilities.
General requirements for portfolio stocks:
- The universe of potential stocks are listed Nordic stocks with an average daily turnover in the past month between one and five million NOK. Your home market can be your universe, which would be an advantage in terms of knowledge about news, share offerings, results presentations and other things that may influence prices. At the same time, it would be an advantage to have a bigger universe to be able to select the very best stocks. Sweden has two to three times as many potential stocks as Norway, which has more than Denmark, while there are fewer yet again in Finland. Including Sweden along with Norway gives good access to good stocks. If you only want to invest in Norway, Denmark or Finland, liquidity would have to be expanded to for instance 0.5 to 10 mNOK, to find the necessary number of candidates.
Figures for average daily turnover are available in the table below the chart/recommendation on Investtechs analysis pages. - Volatility of the stocks should be lower than extreme to avoid the risk of very steep falls. Information about volatility risk is located directly below the charts on Investtechs analysis pages.
- The stocks should be in rising trends or breaking upwards from rising or sideways trends in Investtechs medium long term charts.
- Quantitative requirements:
- Stocks should show neutral or positive volume balance, since volume balance is another indicator that statistically gives excess return. Read the research report on volume balance.
- Stocks should have positive or neutral momentum as measured by RSI, as this has given statistical excess return. Ideally RSI should be above 50, but at least above 30. Read the research report on RSI.
- Stocks should be positive or neutral for insider trades (only available in Norway and Sweden), since this indicates that they are reasonable for fundamental conditions.
Purchase a start portfolio:
- Go through all stocks in your universe, feel free to use Investtechs Stock Selection tool if you can (available for Professional and Institutional subscribers). Select the stocks that satisfy the general requirements, especially rising trend or breaking upwards from rising or sideways trend, by giving them 5 points in My rating (available from Trader level subscriptions and up).
- Go to My Stocks (requires at least a Trader level subscription) where you find all the stocks you have rated. Assess the long and short term charts, and increase the rating for stocks that have rising trends on both time perspectives and/or where some of the other quantitative requirements, like positive volume balance or moment are satisfied.
- Go through the stocks again, this time with section diversification in mind. Rate stocks higher and lower such that the top ones combined give good sector diversification. Feel free to use volatility and liquidity as well to change the stocks rating.
- Repeat the process with subjective assessment and control of other technical and portfolio conditions until you have from 7 to 15 stocks that stand out.
- Assume that you wish to purchase ten stocks. Buy these and place about a tenth of the portfolio value in each stock.
- Feel free to use an online broker and manual adjustment of limits throughout the day to achieve good entry prices.
- The stock will statistically rise about 0.08 per cent a day, so it is more important to get good prices than quick entry.
- Buy such a small percentage of the volume that you only marginally influence prices. Generally it is recommended to purchase no more than 30 per cent of volume.
- Trade over several days if necessary.
Weekly control and replacements:
- Sell stocks that have entered into falling trends in the medium long term or that are breaking downwards from sideways or falling trends.
- Stocks that are breaking downwards from rising trends, give statistically neutral return. Consider selling these.
- Consider selling other stocks if the combination of momentum, volume balance, insider trades (for Norway and Sweden) and other technical or quantitative conditions are clearly negative.
- Find candidates among the stocks in the universe that you do not own. Assess these with the same criteria as the start portfolio. Select the very best and buy them.
- Only sell stocks when you buy new ones, so you are always nearly fully invested in the market. However it is more important to get good intraday prices, so do not stress selling and buying at the exact same time.
For investors who want the opportunity to profit from short term fluctuations:
- Check the portfolio for signals, especially from falling trends, every day instead of every week.
- Check signals in Investtechs short term price charts in addition to the medium long term.
Summary
Make a portfolio of some ten stocks and place roughly the same amount of money in each stock. Buy and hold stocks in rising trends or breaking upwards from rising or sideways trends in the medium long term. Preferably select stocks with an average daily turnover of between one and five million kroner and avoid highly volatile stocks.
Replace a stock when a portfolio stock enters a falling trend, and when it breaks downwards through the floor of a raising trend and there are other good candidates. Use Investtechs analyses to determine when a stock is in a rising, falling or sideways trend, and to check when a trend is broken.
Be long term and disciplined and prepared that it will take time to achieve good statistical results.
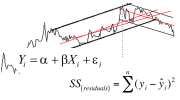
Investtechs forskningsarbete baseras på studier av mer än 350.000 signaler från trender
i börsnoterade nordiska aktier från 1996 till 2015.
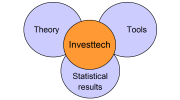
Praktisk användning - Verktyg - Statistik - Algoritmer - Teori
Trendbibeln - startsida Mer om Investtechs forskning
Trendbibeln är skriven av forskningschef Geir Linløkken under 2016. Forskningsteamet bakom Trendbibeln består av seniorforskarna Asbjørn Taugbøl och Fredrik Tyvand, samt Linløkken själv.
Investtech har arbetat med forskning inom behavioural finance, teknisk och kvantitativ aktieanalys sedan 1997. Företaget har utvecklat ett analyssystem som bland annat identifierar trender, stöd och motstånd, formationer och volymmönster i aktiekurser, och ger köp- och sälj-rekommendationer baserat på detta. Investtech gör omfattande användning av avancerade matematiska algoritmer och tunga statistiska metoder i sina dataprogram och internetbaserade abonnemangstjänster.
Die Anlageempfehlungen werden von Investtech.com AS ("Investtech") ausgearbeitet. Investtech übernimmt keine Haftung für die Vollständigkeit oder Richtigkeit der jeweiligen Analyse. Ein etwaiges Engagement aufgrund der aus den Analysen resultierenden Empfehlungen/Signale erfolgt zur Gänze für Rechnung und Risiko des Anlegers. Investtech haftet nicht für Verluste, die sich direkt oder indirekt infolge der Nutzung von Investtechs Analysen ergeben. Angaben zu etwaigen Interessenkonflikten gehen stets aus der Anlageempfehlung hervor. Weitere Informationen zu Investtechs Analysen finden Sie unter disclaimer.
Die Anlageempfehlungen werden von Investtech.com AS ("Investtech") ausgearbeitet. Investtech übernimmt keine Haftung für die Vollständigkeit oder Richtigkeit der jeweiligen Analyse. Ein etwaiges Engagement aufgrund der aus den Analysen resultierenden Empfehlungen/Signale erfolgt zur Gänze für Rechnung und Risiko des Anlegers. Investtech haftet nicht für Verluste, die sich direkt oder indirekt infolge der Nutzung von Investtechs Analysen ergeben. Angaben zu etwaigen Interessenkonflikten gehen stets aus der Anlageempfehlung hervor. Weitere Informationen zu Investtechs Analysen finden Sie unter disclaimer.
Copyright Ⓒ 1997-2024 Investtech.com AS, Org nr 978 655 424 MVA Datenschutzerklärung | Haftungsausschluss
Zentrale
Strandveien 171366 Lysaker, Norway
Forschungsabteilung
Instituttveien 102007 Kjeller, Norway