Stock Selection
Stock selection is the best stock picking tool Investtech offers.
Select your time perspective from the top right drop-down list and which markets and sectors to include. Following are three groups of filters: General criteria, Technical criteria and Financial criteria. Note that certain filters and criteria are only available for some markets.
Markets

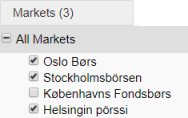
Pick your markets from which to select stocks. For example Oslo, Stockholm and Copenhagen. The report will show stocks that fit your criteria from all three markets, and you may get even better stocks than if you select from one market only.
It can be difficult to find very good candidates in smaller markets when the Exchange is weak or has moved sideways for some time. Multiple markets increase the chance of finding good stocks.
Sectors

The report contains all kinds of companies, regardless of sector or industry. However, you can set sectors like Finance or Energy, or more detailed industries like Insurance or Oil drilling. The report will show only stocks within these sectors that also fit your other criteria.
Combining Markets and Sectors can for instance give ranked lists of the best bank stocks in the Nordic countries.
Filters
Click criteria on and off for each group. An active filter is highlighted in colour, while an inactive filter is neutral. Click and drag the slider to set values for each filter.

Active filter in the middle, inactive on the left and right.
General criteria
General criteria are used to set size, liquidity and volatility of the companies you are looking for. It is easier to trade bigger, more liquid companies, but the best opportunities are often found in smaller companies. Volatility is measured in percentage per month and indicates how much the price has fluctuated historically. Large fluctuations carry high risk, but also often significant upside potential.
Technical criteria

Technical criteria show investor behaviour and the development of optimism in the stocks, interpreted through the stocks' price charts. Technical score is a total assessment of the stock, calculated quantitatively by Investtech's computers. The algorithm assesses trend, support and resistance, volume development and buy signals from price patterns. Investtech's research shows that signals from trend, momentum and volume balance are statistically important, and you may choose to define your own criteria for all of these.
Technical criteria can be useful as a timing tool. According to technical analysis, optimism in stocks with these technical signals is increasing and the price will continue upwards in the next weeks and months.
Financial criteria

Financial criteria cover company valuation. These are criteria used in fundamental stock analysis.
Financial criteria can be useful in finding stocks that are cheap based on key ratios. Fundamental analysts expect many such stocks to rise in the long term. Note that financial key ratios can vary a great deal from sector to sector, and knowledge of the sector and the individual companies are often necessary for interpretation of key ratio figures.
Explanation of table

The table is automatically sorted by technical score. Click the column headings to sort by other values.
Technical score: Technical evaluation of the stock is done automatically by Investtech’s computers. The evaluation scale is from -100 to +100, where scores below -50 are "negative candidates", between -50 and -25 are "weak negative", between -25 and +25 are "watch", between 25 and 50 are "weak positive" and over 50 are “positive candidates”.
CAP: Capitalised value is market value in billion, calculated as stock price multiplied by shares outstanding.
Liquidity: Average daily turnover in million in the past month.
Volatility: Average difference between the highest and lowest price per month, calculated for the past year. Volatility is a common measurement of risk.
Rsi21: 21 day Relative Strength Index. Used to measure the short term momentum of the stock.
Volbal: 22 day Volume Balance. Measures volume vs price movement.
Yield: Dividend yield is the company's share dividend in relation to the share price. It is a measure of return to shareholders. Dividend yield is calculated as Dividend per share/Share price.
P/E: P/E stands for Price/Earnings, that is, share price in relation to the earnings per share. The key figures are used when assessing a share price in relation to the company's profit.
P/S :P/S stands for Price/Sales, that is price relative to sales. The key figures are used when evaluating a share price in relation to the company's sales.
P/B: P/B stands for Price/BookValue, that is price relative to equity. The key figures are used when evaluating a share price in relation to book equity.
Overall: Shows the sum of market value and daily liquidity for all stocks. The values for columns Technical score, Volatility, RSI, VolBal and Yield are a weighted average, where the weight is capitalized value. The values for columns P/E, P/S and P/B are calculated as the sum of market value (P) divided by the sum of Earnings (E), Sales (S) and BookValue (B) respectively.
Mean: Average value for all stocks.
Median: Median value for all stocks.
Die Anlageempfehlungen werden von Investtech.com AS ("Investtech") ausgearbeitet. Investtech übernimmt keine Haftung für die Vollständigkeit oder Richtigkeit der jeweiligen Analyse. Ein etwaiges Engagement aufgrund der aus den Analysen resultierenden Empfehlungen/Signale erfolgt zur Gänze für Rechnung und Risiko des Anlegers. Investtech haftet nicht für Verluste, die sich direkt oder indirekt infolge der Nutzung von Investtechs Analysen ergeben. Angaben zu etwaigen Interessenkonflikten gehen stets aus der Anlageempfehlung hervor. Weitere Informationen zu Investtechs Analysen finden Sie unter disclaimer.
Die Anlageempfehlungen werden von Investtech.com AS ("Investtech") ausgearbeitet. Investtech übernimmt keine Haftung für die Vollständigkeit oder Richtigkeit der jeweiligen Analyse. Ein etwaiges Engagement aufgrund der aus den Analysen resultierenden Empfehlungen/Signale erfolgt zur Gänze für Rechnung und Risiko des Anlegers. Investtech haftet nicht für Verluste, die sich direkt oder indirekt infolge der Nutzung von Investtechs Analysen ergeben. Angaben zu etwaigen Interessenkonflikten gehen stets aus der Anlageempfehlung hervor. Weitere Informationen zu Investtechs Analysen finden Sie unter disclaimer.


 Oslo Børs
 Stockholmsbörsen
 Københavns Fondsbørs
 Helsingin pörssi
 World Indices
 US Stocks
 Toronto Stock Exchange
 London Stock Exchange
 Euronext Amsterdam
 Euronext Brussel
 DAX
DAX CAC 40
 Mumbai S.E.
 Commodities
 Currency
 Cryptocurrency
 Exchange Traded Funds
 Investtech Indices


