
 Oslo Børs
 Stockholmsbörsen
 Københavns Fondsbørs
Investeringsforeninger
Københavns Fondsbørs
Investeringsforeninger
 Helsingin pörssi
 World Indices
 US Stocks
US 30
Nasdaq 100
US 500
US Stocks
US 30
Nasdaq 100
US 500
 Toronto Stock Exchange
 London Stock Exchange
 Euronext Amsterdam
 Euronext Brussel
 DAX
SDAX
TECDAX
Frankfurt
CDAX
MDAX
Prime Standard
DAX
SDAX
TECDAX
Frankfurt
CDAX
MDAX
Prime Standard
 CAC 40
 Mumbai S.E.
National S.E.
Mumbai S.E.
National S.E.
 Commodities
 Currency
 Cryptocurrency
 Exchange Traded Funds
 Investtech Indices
One Buy and One Sell Signal
Published November 27, 2018
Webinar November 28th
Join our free online webinar on Wednesday November 28th. Analyst Kiran Shroff and Country Manager Jan Marius van Leeuwen will give an introduction to Investtech's analyses and present stock picking tools & strategies.
It was a positive day on Dalal Street on Monday and a good set up, a happy tone for the rest of the week. Nifty 50 long term price chart clearly suggests that price is clinging to its uptrend channel, which is keeping all our hopes alive. Turning on to advance-decline ratio for Nifty 50, it was little over 2, indicating that two stocks rose while one fell yesterday. Well enough.
Another heavyweight that made a fresh 52 week low was ONGC, while ABB, our positive candidate today, may look like an early opportunity to encash in.
ABB India Limited (ABB.NS) Close: 1348.70
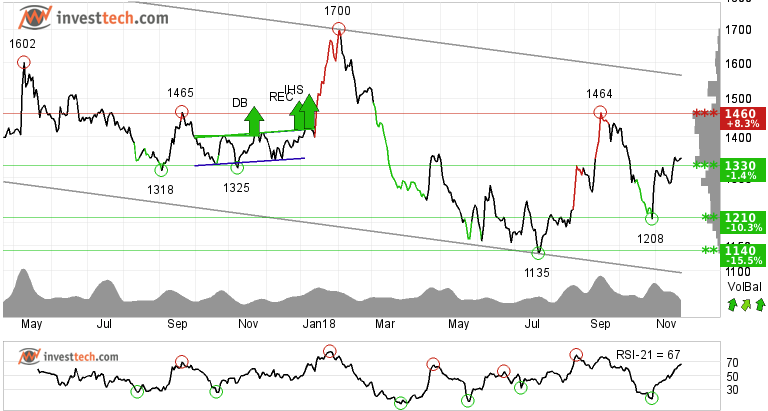
ABB India Limited is in a rising trend channel both in the long and short term, while it is in a weak falling trend channel in the medium term. After establishing a bottom at 1135 rupees in July this year, the stock has recovered very well and is above a few resistance levels.
Currently the stock is trading above 1330 rupees while the next resistance is around 1460 or eight per cent higher. This poses itself to be a good opportunity. There is support around 1330-1310 levels. Momentum is rising and the volume balance indicator is also very positive. These indicators support the rising stock price. The stock is overall assessed as technically positive for the medium to longer term perspective.
Investtech's outlook (one to six months): Positive
Oil & Natural Gas Corp (ONGC.NS) Close: 146.60
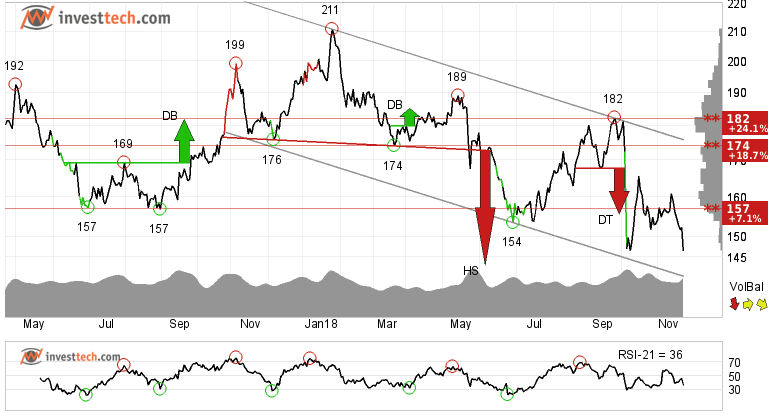
The oil and gas giant ONGC is in a falling trend channel in the medium term. This shows that investors over time have sold at lower prices to get out of the stock, and indicates negative development for the company. The stock has closed near its 52 week low and has also broken its longer term support of 157 rupees. If tomorrow prices continue to trade lower that its last close, it may initiate a new sell signal.
Next support in ONGC is at 128 rupees while resistance is around 157-161 levels. The stock is overall assessed as technically slightly negative for the short to medium term.
Investtech's outlook (one to six months): Negative
The analyses are based on closing price as per November 26, 2018. Maintaining proper stop loss is always recommended.
Verfasst von

Analyst
Investtech
Archive:
23 November: Fear dominates these stocks
21 November: Sell signal, time to stay away
20 November: Early opportunity from short term buy signal?
16 November: Two Buy Signals and One Sell Signal
15 November: Buy signal in this one
13 November: Big auto stocks comparison
09 November: What to wait for?
06 November: Banking stocks look positive
02 November: Positive on this one
01 November: TECHM, NIFTY50 and Hausse
31 October: What are investors thinking?
30 October: Bullish on these three stocks
26 October: Three potential candidates to ride on
24 October: Three big Metal stocks, Seasonal variation
22 October: Among top performers on our Top 50 list
18 October: Three stocks investors should stay away from
17 October: Flowing against the tide
16 October: Positive on these 2 stocks
11 October: Over 45 per cent rise
9 October: The Indian banking space
5 October: Nifty closes at a crucial level
2 October: Price formations in the long-term charts
28 September: Positive on Biocon Limited
"Investtech analysiert die Psychologie des Marktes und macht Ihnen täglich konkrete Tradingvorschläge."

Partner & Senior Advisor - Investtech


Die Anlageempfehlungen werden von Investtech.com AS ("Investtech") ausgearbeitet. Investtech übernimmt keine Haftung für die Vollständigkeit oder Richtigkeit der jeweiligen Analyse. Ein etwaiges Engagement aufgrund der aus den Analysen resultierenden Empfehlungen/Signale erfolgt zur Gänze für Rechnung und Risiko des Anlegers. Investtech haftet nicht für Verluste, die sich direkt oder indirekt infolge der Nutzung von Investtechs Analysen ergeben. Angaben zu etwaigen Interessenkonflikten gehen stets aus der Anlageempfehlung hervor. Weitere Informationen zu Investtechs Analysen finden Sie unter disclaimer.
Die Anlageempfehlungen werden von Investtech.com AS ("Investtech") ausgearbeitet. Investtech übernimmt keine Haftung für die Vollständigkeit oder Richtigkeit der jeweiligen Analyse. Ein etwaiges Engagement aufgrund der aus den Analysen resultierenden Empfehlungen/Signale erfolgt zur Gänze für Rechnung und Risiko des Anlegers. Investtech haftet nicht für Verluste, die sich direkt oder indirekt infolge der Nutzung von Investtechs Analysen ergeben. Angaben zu etwaigen Interessenkonflikten gehen stets aus der Anlageempfehlung hervor. Weitere Informationen zu Investtechs Analysen finden Sie unter disclaimer.
Copyright Ⓒ 1997-2024 Investtech.com AS, Org nr 978 655 424 MVA Datenschutzerklärung | Haftungsausschluss
Zentrale
Strandveien 171366 Lysaker, Norway
Forschungsabteilung
Instituttveien 102007 Kjeller, Norway