
 Oslo Børs
 Stockholmsbörsen
 Københavns Fondsbørs
Investeringsforeninger
Københavns Fondsbørs
Investeringsforeninger
 Helsingin pörssi
 World Indices
 US Stocks
US 30
Nasdaq 100
US 500
US Stocks
US 30
Nasdaq 100
US 500
 Toronto Stock Exchange
 London Stock Exchange
 Euronext Amsterdam
 Euronext Brussel
 DAX
SDAX
TECDAX
Frankfurt
CDAX
MDAX
Prime Standard
DAX
SDAX
TECDAX
Frankfurt
CDAX
MDAX
Prime Standard
 CAC 40
 Mumbai S.E.
National S.E.
Mumbai S.E.
National S.E.
 Commodities
 Currency
 Cryptocurrency
 Exchange Traded Funds
 Investtech Indices
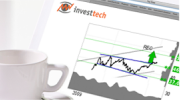
Positive divergence between RSI and price, and price near support
Positive divergence between RSI and price implies that the price will rise. Price near support implies that the price will rise. At the same time, placing stop loss just below support ensures a small downside.
Theory:
RSI measures the degree to which buyers or sellers have been influencing the price lately. Low values mean that sellers have been most influential, while high values mean that buyers have been most influential.
When the RSI chart is increasing, this means that buy interest is increasing and that buyers get relatively more influence in determining the price. If this happens while the price is moving sideways, or downwards, this is seen as an early signal of a possible upward movement of the price.
The fact that the price is near the support means that when the price was at this level previously, the price showed an upward reaction. Investors who did not profit from the last increase, will want to buy now, and those who did buy the last time, but sold again, will want to buy again.
When these criteria occur simultaneously, we get a strong signal that the price will rise. At the same time, we have the opportunity to invest with low risk, by placing a stop loss just below the support.
Score:
The degree of divergence between RSI and price is important for the calculation of the score. In addition, the price should be near the support and the support should be strong. Volume balance and the relationship between volume tops and price tops is also considered. Trend and price patterns also are taken into account.
Buying price:
Is set one "normal movement" above the support level. A "normal movement" is defined as the average price movement during a period equal to about one per cent of the length of the chart.
Price target:
Is set to the estimated theoretical maximum price, given that the price develops as a slightly coloured random walk for 20 % of the length of the chart.
Normally, this will be 15-30 per cent of the height of the chart.
Stop loss:
Is set to approximately one "normal movement" below the support level.
Time horizon:
Is set from 14 to 20 % of the length of the chart.

Investtech guarantees neither the entirety nor accuracy of the analyses. Any consequent exposure related to the advice / signals which emerge in the analyses is completely and entirely at the investors own expense and risk. Investtech is not responsible for any loss, either directly or indirectly, which arises as a result of the use of Investtechs analyses. Details of any arising conflicts of interest will always appear in the investment recommendations. Further information about Investtechs analyses can be found here disclaimer.
The content provided by Investtech.com is NOT SEC or FSA regulated and is therefore not intended for US or UK consumers.
Copyright Ⓒ 1997-2024 Investtech.com AS, Org nr 978 655 424 MVA Privacy Policy | Conditions générales d'utilisation et avis de précaution
Head office
Strandveien 171366 Lysaker, Norway
Research department
Instituttveien 102007 Kjeller, Norway