
 Oslo Børs
 Stockholmsbörsen
 Københavns Fondsbørs
Investeringsforeninger
Københavns Fondsbørs
Investeringsforeninger
 Helsingin pörssi
 World Indices
 US Stocks
US 30
Nasdaq 100
US 500
US Stocks
US 30
Nasdaq 100
US 500
 Toronto Stock Exchange
 London Stock Exchange
 Euronext Amsterdam
 Euronext Brussel
 DAX
SDAX
TECDAX
Frankfurt
CDAX
MDAX
Prime Standard
DAX
SDAX
TECDAX
Frankfurt
CDAX
MDAX
Prime Standard
 CAC 40
 Mumbai S.E.
National S.E.
Mumbai S.E.
National S.E.
 Commodities
 Currency
 Cryptocurrency
 Exchange Traded Funds
 Investtech Indices
Today's free analyses
OMX Stockholm PI (OMXSPI)
Cours de clôture: 993.8700 (6.0700), 26. juillet 2024
Conclusion légèrement négative
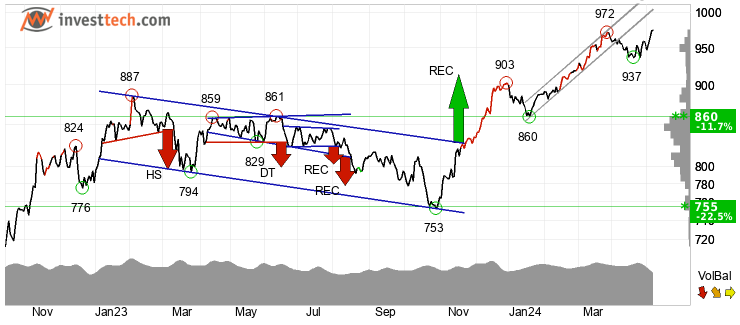
OMX Stockholm PI fluctue dans un canal haussier et une progression poursuivant le canal haussier est indiquée. En cas de corrections à la baisse il y a du support en bas du canal haussier. La valeur a cru fortement après un signal d'achat d'une formation rectangulaire sur le franchissement de la résistance à 828 l'objectif de 914 est maintenant atteint, mais la formation indique une poursuite du développement dans la même direction. L'indice a marginalement franchi le support à environ 1000 points. Un franchissement établi et persistant peut indiquer une poursuite de la baisse. Les hauts des volumes et des prix correspondent aux hauts des prix. Ceci affaiblit la tendance haussière et peut être un signal précurseur d'un futur changement de tendance. L'indice est généralement considéré comme légèrement negatif technique pour moyen long terme.
Evolution (EVO)
Cours de clôture: 1033.0000 (18.5000), 26. juillet 2024
Négatif

Evolution a débordé le canal baissier à la hausse, ce qui, dans un premier temps, indique un taux de repli moins fort. L'action rencontre du support à environ 980 kronor et de la résistance à environ 1210 kronor. La balance des volumes négative affaiblit la valeur sur le court terme. L'action est généralement considéré comme negatif technique pour moyen long terme.
Partenaires


Kommande evenemang
Inga planerade kurser.Tidigare:
| Datum | Plats | Titel | |
|---|---|---|---|
| 22 nov 2023, kl 16.00 - 21.00 | Stockholm, Sverige | Stora Tradingdagen 2023 med IG | |
| 8 nov 2023, kl 17.00 - 19.30 | Oslo, Norge | Seminar: Muligheter og utfordringer i høstens investeringsklima | |
| 8 nov 2023, kl 17.00 - 19.30 | Oslo, Norge | Seminar: Muligheter og utfordringer i høstens investeringsklima | |
| 27 sept 2023, kl 17.00 - 19.30 | Bergen, Norge | Seminar: Investorkveld med Investtech og CMC Markets | |
| 16 nov 2022, kl 17.00 - 19.30 | Oslo, Norge | Seminar: Muligheter og utfordringer i høstens investeringsklima | |
| 29 sep 2022, kl 17.30 - 19.30 | Stavanger, Norge | Seminar: Investorkveld med Investtech og CMC Markets | |
| 28 sep 2022, kl 17.30 - 19.30 | Bergen, Norge | Seminar: Investorkveld med Investtech og CMC Markets | |
| 21 sep 2022, kl 17.30 - 19.30 | Oslo, Norge | Kurs: Investtechs analyser, aksjeplukking og fond | |
| 14 sep 2022, kl 17.30 - 19.30 | Trondheim, Norge | Kurs: Investtechs analyser, aksjeplukking og fond |
Hur Investtech fungerar

Samla marknadsdata
Pris, volym, insynsinformation, företagshändelser etc.

Utför avancerad analys
Använder matematisk mönsterigenkänning, statistisk optimering och behavioural finance

Leverera angripbara insikter
Dagligen över aktierna, indexen och råvarorna som hör störst betydelse för din portfölj
topMenu.Pricing
Investor
Everything you need to start planning your investment decisions.
SEK
340
SEK
249
/ mois
Billed Annually: SEK 2990
Commander- Analysis of stocks listed at NASDAQ OMX Stockholm
- Medium and long term charts ⓘAnalyses for the medium and long term, respectively 1-6 months and 1-6 quarters investment perspective.
Medium and long term charts → - Concrete buy and sell signals ⓘSpecific buy and sell signals for each stock.
- Health Check ⓘGet a detailed portfolio health check.
- Today's Case ⓘToday's Case gives you a selected stock which is technically positive.
- Top 50 ⓘThe Top50 list provides you with a ranking of the 50 most positive/negative stocks.
Top 50 → - Price alerts ⓘYou may enter a price alert for a stock and be notified when the price reaches this level.
Price alerts → - Watchlist ⓘCreate a watchlist of stocks you are interested in.
- My portfolios ⓘGain better control of your investments with Investtech`s portfolio system.
My portfolios → - Model portfolio ⓘThe Model Portfolio aims to show how active investors can achieve good return by using Investtech's analyses.
Model portfolio → - Factor diagram ⓘThe Factor diagram visualises the stock's four most important qualities.
Factor diagram →
Most Popular
Trader
Take your investment decisions to another level with short term analyses and more advanced tools.
SEK
720
SEK
499
/ mois
Billed Annually: SEK 5990
Commander- All Investor features
- +
- Short term charts and analyses ⓘAnalyses for the short term, 1-6 weeks investment perspective.
Short term charts and analyses → - Morning reports ⓘThe report consists of daily evaluations by Investtech`s automated analysis system.
- Trend signals ⓘThe Trend signals tool shows stocks that recently entered into a rising or falling trend.
Trend signals → - Pivot points ⓘPivot points are tops and bottoms in the chart.
Pivot points → - Key ratios ⓘKey financial indicators give information about a company's performance based on reported financial results for a given time period.
Key ratios → - Trading ideas ⓘTrading Ideas is an inspiration for short term investments.
Trading ideas → - Stay away portfolio ⓘThis Portfolio aims to show subscribers which stocks Investtech's analyses say to stay away from.
Stay away portfolio → - Trading limits ⓘTrading Limits shows the stocks historical development throughout the trading day and its statistical price fluctuation.
Trading limits → - Complete report ⓘComplete report is a full overview of available information about the company.
- Factor diagram ⓘThe Factor diagram visualises the stock's five most important qualities.
Factor diagram → - Candlesticks ⓘCandlestick analysis is the best tool for doing a detailed short term volume analysis.
Candlesticks →
Professional
A wide range of advanced selection tools and overall analysis to scale your investments.
SEK
1490
SEK
1040
/ mois
Billed Annually: SEK 12490
Commander- All Trader features
- +
- Overall analysis ⓘOverall analysis for all time perspectives; long, medium and short term.
Overall analysis → - Stock selection ⓘStock selection is likely the best stock picking tool Investtech offers. The most common usage is to select liquidity and time perspective, e.g. 50 % most liquid and short term.
Stock selection → - Insider trade analysis ⓘAnalysis of insider trades is InvesttechÕs alternative to fundamental analysis.
Insider trade analysis → - Hausse ⓘThe Hausse indices are indicators of optimism.
Hausse → - Result Analysis ⓘHow the stock price has moved before and after the company's publication of accounting figures.
Result Analysis → - Compare stocks ⓘCompare the price development of a stock with 30,000 other stocks, commodities and indices.
Compare stocks → - Trading opportunities ⓘThe Trading opportunities table is a stock picking tool. The table shows stocks with combinations of technical indicators that strongly indicate further rise or fall.
Trading opportunities → - Seasonal variations ⓘAnalysis of seasonal variations shows how a stock statistically has varied throughout the year.
Seasonal variations → - Chart view of ranking lists ⓘGraphic chart view of all ranking lists.
- Ranking by signals ⓘAn overview of the latest buy and sell signals identified by Investtech`s systems. Signals from price patterns are assumed to indicate in which direction the majority of investors are moving.
Ranking by signals → - Early warning ⓘIn the early warning service Investtech.com calculates the price levels that will trigger the next days buy and sell signals (signal levels).
Early warning →
Institutional
Access to all 30,000 stocks, commodities and currencies, suited for experienced investment strategists.
Get in touch
Nous contacter - All Professional features
- +
- All 30,000 stocks, commodities and currencies ⓘAll 30,000 stocks, commodities and currencies.
- Self-defined universes ⓘDefine your own universe of stocks.
- Alarms ⓘOverview of the stocks in your universes that have triggered signals.
- Personal customer service representative for technical questions ⓘContact your personal customer service representative with any technical questions you may have.
- Flexible selection criteria ⓘWide range of flexible selection criteria.
Om oss

Investtech grundades 1997 och är ett ledande skandinaviskt företag inom forskning på behavioural finance och teknisk aktieanalys. Investtechs forskningsresultat används i ett beslutstödssystem som analyserar aktier och andra värdepapper. Systemet används dagligen av investerare över hela världen.
Avancerade matematiska modeller och statistisk optimering utgör grunden för analyserna som ger objektivt och transparent beslutsstöd. Investtech levererar nätbaserade abonnemangstjänster till privata investerare och har varit en framträdande leverantör av teknisk aktieanalys till finansiella institutioner, mäklarhus och media sedan 1999. Kurser, seminarier och webbinarier arrangeras både direkt för kunder och i samarbete med partners.

Copyright Ⓒ 1997-2024 Investtech.com AS, Org nr 978 655 424 MVA Privacy Policy | Conditions générales d'utilisation et avis de précaution
Head office
Strandveien 171366 Lysaker, Norway
Research department
Instituttveien 102007 Kjeller, Norway
×
