Oslo Børs
 Stockholmsbörsen
 Københavns Fondsbørs
Investeringsforeninger
Københavns Fondsbørs
Investeringsforeninger
 Helsingin pörssi
 World Indices
 US Stocks
US 30
Nasdaq 100
US 500
US Stocks
US 30
Nasdaq 100
US 500
 Toronto Stock Exchange
 London Stock Exchange
 Euronext Amsterdam
 Euronext Brussel
 DAX
SDAX
TECDAX
Frankfurt
CDAX
MDAX
Prime Standard
DAX
SDAX
TECDAX
Frankfurt
CDAX
MDAX
Prime Standard
 CAC 40
 Mumbai S.E.
National S.E.
Mumbai S.E.
National S.E.
 Commodities
 Currency
 Cryptocurrency
 Exchange Traded Funds
 Investtech Indices
Today's free analyses
Dax (Performanceindex) (DAX)
Cours de clôture: 18418.0000 (118.8300), 26. juillet 2024
Conclusion légèrement positive
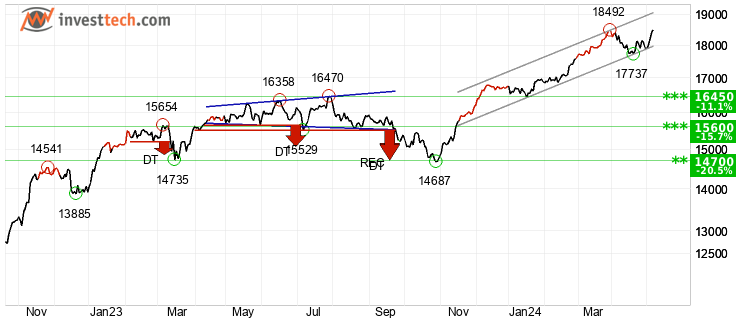
Dax (Performanceindex) a débordé le plancher du canal haussier, ce qui dans un premier temps, indique un taux de croissance plus faible. L'indice rencontre du support à environ 18000 points et de la résistance à environ 18860 points. L'indice est considéré comme légèrement positif technique pour moyen long terme.
Deutsche Post AG (DHL)
Cours de clôture: 40.4800 (0.3900), 26. juillet 2024
Positif

Deutsche Post AG fluctue dans un canal presque horizontal et un développement dans la même direction est indiqué. La valeur a atteint l'objectif de 40.81 après le franchissment d'une formation double-creux. Le cours de la valeur a perdu un peu depuis la hausse recente, par contre la formation reconnue, indique une poursuite de la hausse. L'action a franchi la résistance à environ 40.00 Euro. Une poursuite de la hausse est donc indiquée, et il y a maintenant un support à 40.00 Euro en cas de corrections. L'action est généralement considéré comme positif technique pour moyen long terme.
Partenaires


Investtech Webinar über Technische Analysen
Zurzeit kein Webinar.| Datum | Uhrzeit | Titel | |
|---|---|---|---|
| December 4, 2023 | 17.00 - 17.35 CST | Get started with Investtech | |
| March 2, 2022 | 19.30 - 20.15 CST | Get started with Investtech | |
| May 18, 2021 | 18.00 - 19.15 CEST | Introduction to investing and stock analysis. | |
| September 24, 2020 | 19.00 - 19.45 CEST | Introduction to Investtech by Country Manager Jan Marius van Leeuwen. | |
| August 27, 2020 | 19.00 - 19.45 CEST | Introduction to Investtech by Country Manager Jan Marius van Leeuwen. | |
| May 26, 2020 | 19.00 - 19.45 CEST | Introduction to Investtech by Country Manager Jan Marius van Leeuwen. | |
| June 26, 2019 | 10.00 - 10.30 CEST | Volume - Reality check!by Analyst Kiran Shroff. | |
| May 7, 2019 | 10.00 - 10.30 CEST | Trend is your best friend by Analyst Kiran Shroff. | |
| Dec 13, 2018 | 15.00 - 15.40 CET | Introduction to Investtech by Sales Manager Jan Marius van Leeuwen and Analyst Kiran Shroff. | |
| Nov 28, 2018 | 15.00 - 15.40 CET | Introduction to Investtech by Sales Manager Jan Marius van Leeuwen and Analyst Kiran Shroff. | |
| Nov 14, 2018 | 15.00 - 15.40 CET | Introduction to Investtech by Sales Manager Jan Marius van Leeuwen and Analyst Kiran Shroff. | |
| Oct 31, 2018 | 09.00 - 09.40 CET | Introduction to Investtech by Sales Manager Jan Marius van Leeuwen and Analyst Kiran Shroff. |